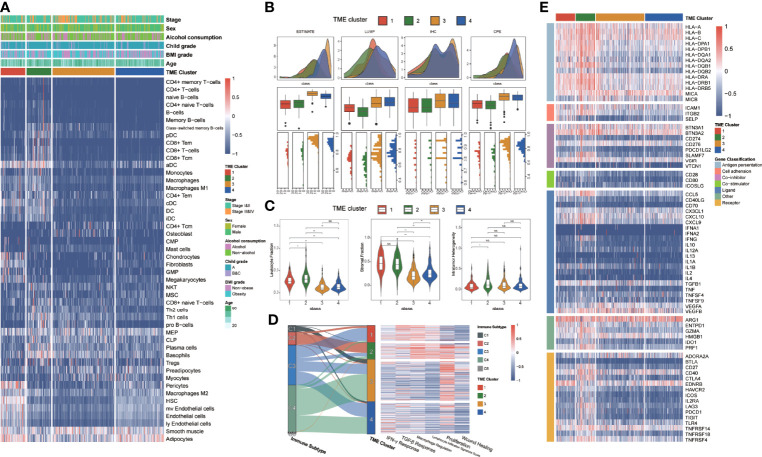
Figure 3.
The immune characteristics of different TME clusters. (A) Unsupervised clustering of TME cells for 370 patients in TCGA database. Clinical stage, sex, alcohol consumption, Child grade, BMI grade, age, and TME cluster were shown as patient annotations. (B) The boxplots showed the comparison of tumor purities with ESTIMATE, LUMP, IHC, and CPE, respectively. The thick line represents the median value. The bottom and top of the boxes were the 25th and 75th percentiles (interquartile range). The whiskers encompassed 1.5 times the interquartile range. The statistical difference of four groups was compared through the Kruskal–Wallis test. (C) Violin plots showed the comparison of immunocompetence with leukocyte fraction, stromal fraction, and intratumor heterogeneity respectively. The differences between every two groups were compared through the Kruskal–Wallis test. (D) Sankey diagram illustrates change between the immune subtype and TME cluster in each patient. Heatmap of IFN-γ response, TGF-β response, macrophage regulation, lymphocyte infiltration, proliferation, and wound healing in different TME clusters. (E) Heatmap of immune genes that were differentially expressed in patients from different TME clusters. *p≤ 0.05, **p≤ 0.01, ns: p> 0.05.

