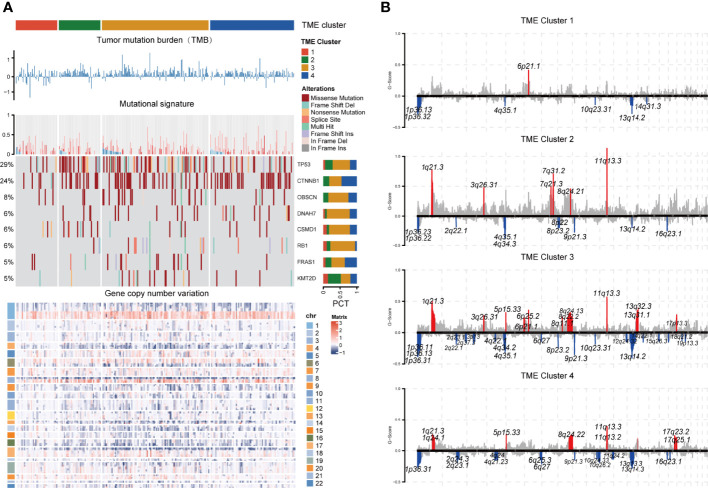
Figure 5.
Genomic alteration landscape of each TME cluster. (A) The log10TMB of each cluster, gene-level CNV mutational signature, waterfall chart of significant (>5%) and differently (Fisher’s exact test p < 0.1) mutated genes, and heatmap of gene copy number variation were shown from the top to the bottom panels. Patients were ordered by the combined contribution of APOBEC-related mutational signatures (SBS2 + SBS13) with each cluster. (B) GISTIC copy number variation analysis. The amplifications and deletions of chromosomal regions were colored red and blue, respectively (FDR cutoff: 0.01).

