Figure 4.

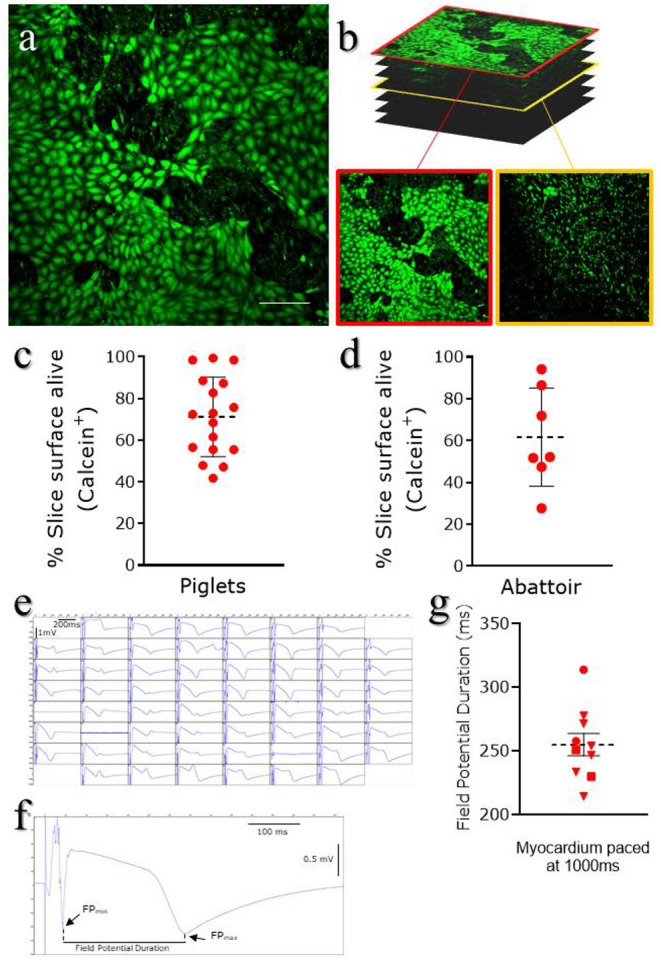
Epicardial slices viability. Viability was assessed using Calcein AM live staining. Live cells are stained green. (a) Representative image of live staining of an epicardial slice imaged using confocal microscopy. Scale bar, 100 μm. (b) Representative images of Z-stack confocal acquisition of live/dead staining of epicardial slice, showing epicardial cells monolayer on the surface of the slice (red outline) and underlying fibroblasts/myocardium (yellow outline). (c) Quantification of alive area of the surface of piglet slices (Mean and SEM: 71.21 ± 4.61%; N of slices = 17/ N of Pigs = 10) and (d) abattoir-derived slices (Mean and SEM: 61.65 ± 8.88%; N of slices = 7/ N of Pigs = 4). (e) Representative field potential traces recorded from cardiomyocytes within the epicardial slices and (f,g) field potential duration, measured as the time between the depolarisation peak (FPMIN) and the repolarization peak (FPMAX) (Mean and SEM was 254.87 ± 8.86 ms; N of slices = 10/ N of Pigs = 3).
