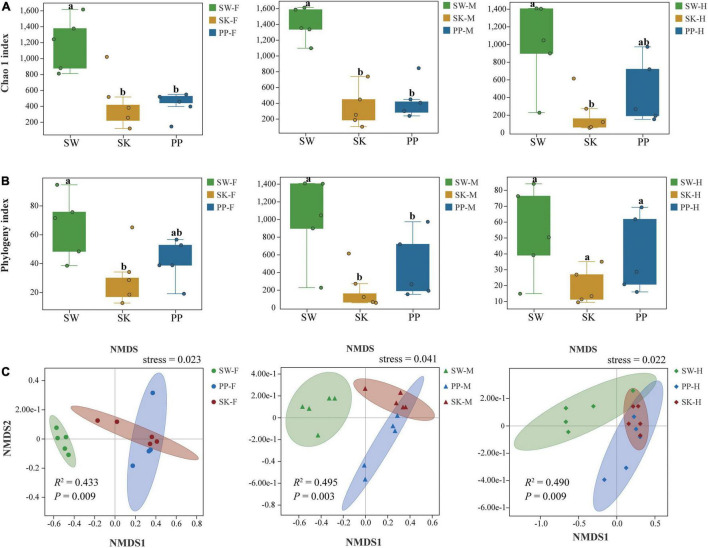
FIGURE 5.
Alpha and beta diversity of gut microbes of the three cold-water fishes. (A) The Chao 1 index was calculated for the foregut, midgut, and hindgut of SW, SK, and PP. (B) The phylogeny index was calculated for the foregut, midgut, and hindgut of SW, SK, and PP. In the box plot, the top line represents the upper quartile (75th percent), the bottom line represents the lower quartile (25th percent), and the line between the top and bottom lines represents the median. The black points represented the outliers. (C) Non-metric multidimensional scaling (NMDS) analysis based on Bray–Curtis distances to explore the dissimilarity in the gut microbes of the three cold-water fishes among different intestinal sections. From left to right: foregut, midgut, and hindgut.

