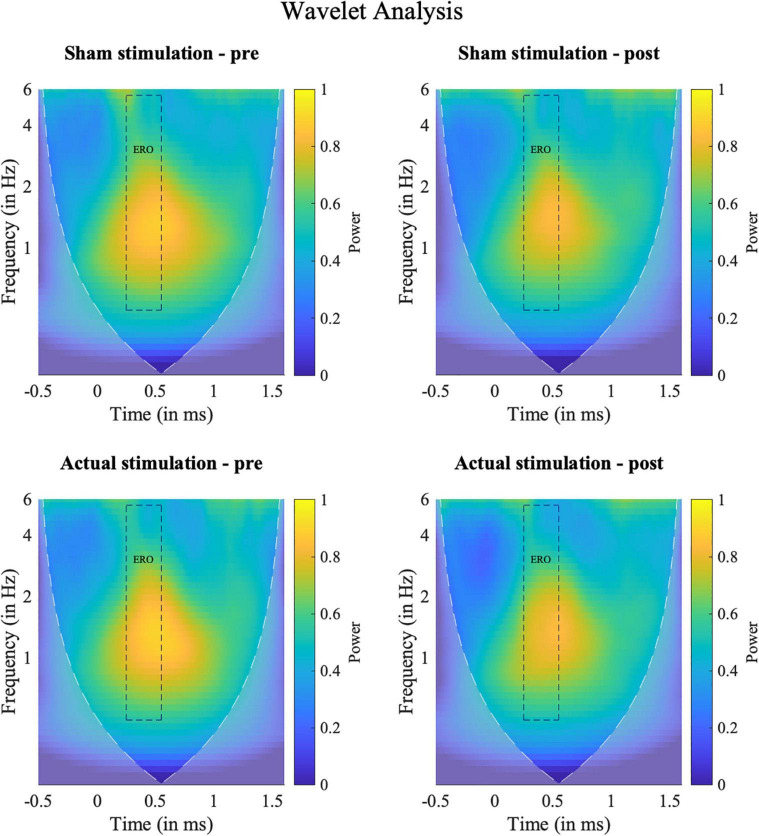
FIGURE 6.
Results of the frequency analyses. Time-Frequency spectra of the wavelet analyses for target hits for the ERO between 0 and 6 Hz at electrode Pz (Grand average). Squares indicate the temporal (0.25–0.5 s) and spectral (0.5–5.5 Hz) region of interest used for the statistical evaluation. Shaded areas outline the area where the calculated wavelet power might be distorted due to edge artifacts.

