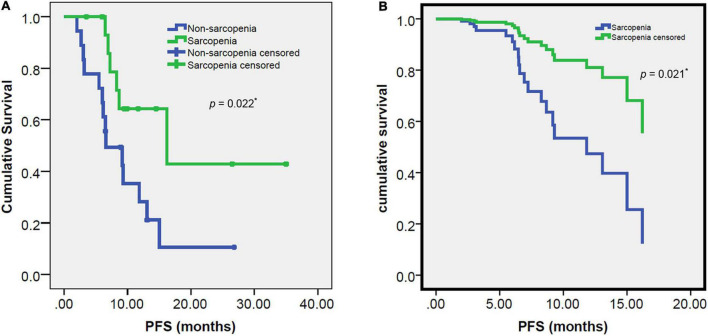
FIGURE 3.
Progression free survival (PFS) survival curves: estimated by Kaplan-Meier method and log-rank test (A) and estimated by multivariate analysis of Cox proportional hazards regression model (B) for the sarcopenia and non-sarcopenia groups. The PFS was significantly worse in the sarcopenia group than the non-sarcopenia group (6.57 vs. 16.2 months, p = 0.022, 0.021, respectively). *Indicates significant difference.

