
Figure 4.
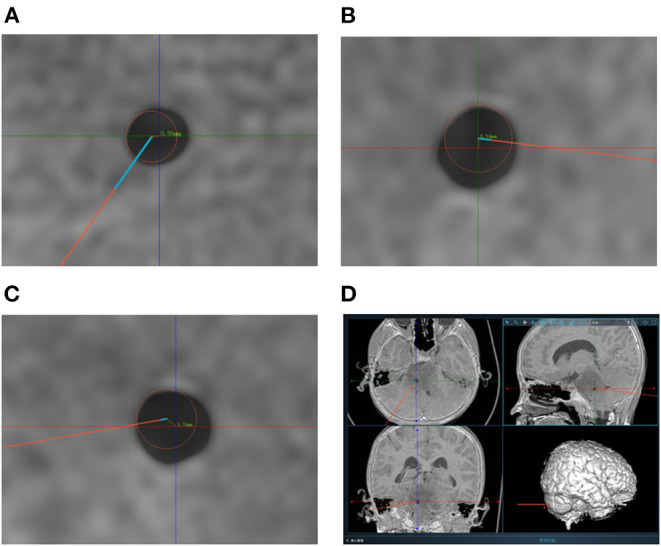
(A–C) Measurement of target point error based on postoperative CT scanning. The centers of the red circles represent the target points planned preoperatively. The TPEs are computed based on the errors from axial position, coronal position and sagittal position respectively. (D) The picture shows the measurement of one of the patients. And the TPEs were 0.52, 0.54, and 0.76 mm, respectively. The actual TPE was 1.07 mm.