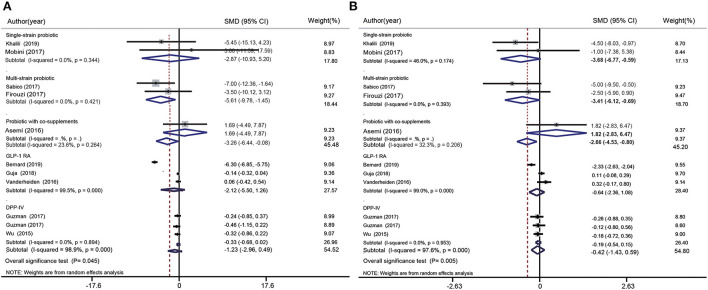
Figure 5.
Forest plot for the effect of probiotics supplementation and glucose-lowering drugs on SBP (mmHg) (A) and DBP (mmHg) (B) compared to placebo. For each study, the solid black diamonds represent the point estimate of the intervention effect. The horizontal line joins the lower and upper limits of the 95% CI of this effect. The open diamonds represent the subgroup and overall SMD determined with a random-effects model.

