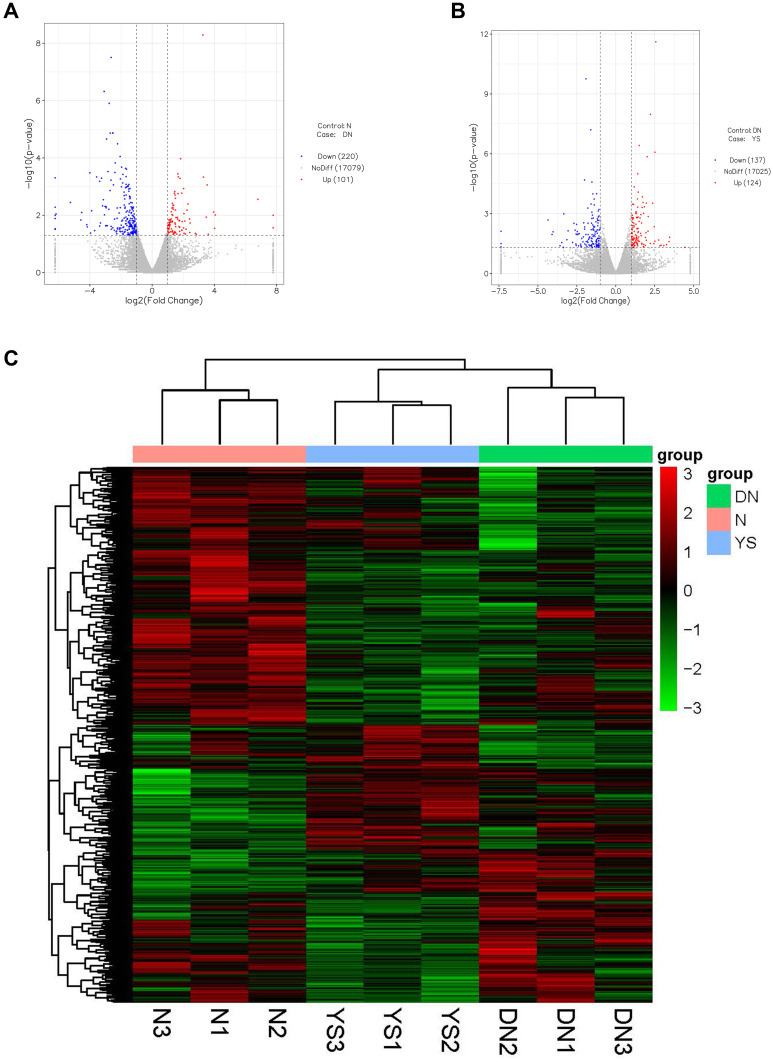
Figure 2.
Differentially expressed genes (DEGs) of the normal group versus DN group and YS group. (A) The volcano map of 321 DEGs between the normal group and DN group. (B) The volcano map of 261 DEGs between DN group and YS group. (C) Hierarchical clustering analysis of kidney samples between normal group, DN group and YS group, from 3 independent rats. The abscissa represents the log2FoldChange, and the ordinate indicates -log10 (p-value) of gene expression between the two groups. Up-regulated genes were red dots and down-regulated genes were blue dots.

