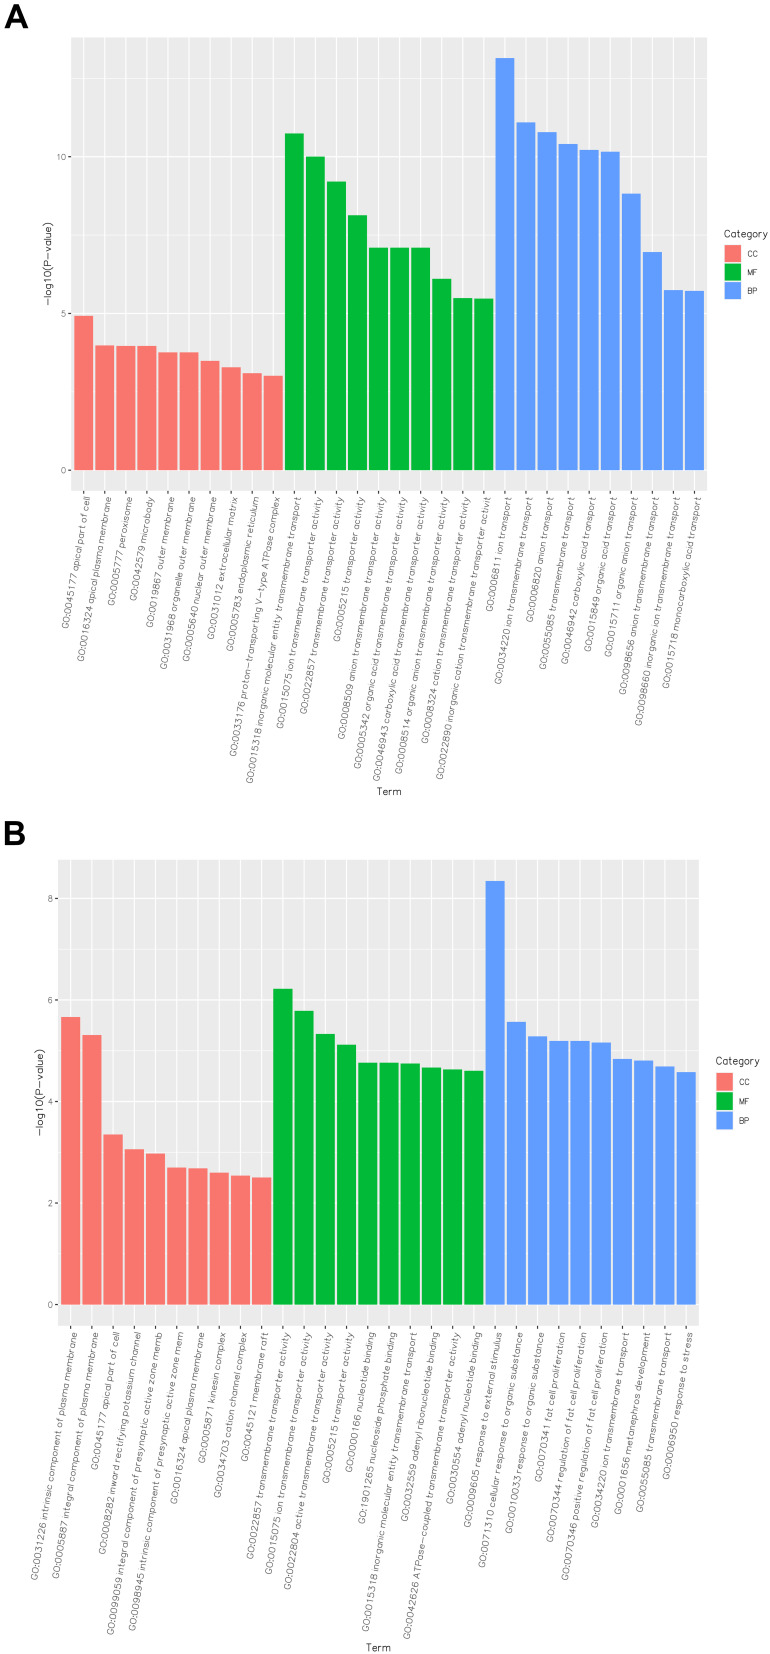
Figure 3.
Functional and pathway enrichment analysis of DEGs among the different groups of rats. (A) GO enrichment analysis of DEGs in the normal group of rats compared with DN rats. (B) GO enrichment analysis of DEGs in DN group of rats compared with YS group rats.
Abbreviations: CC, cellular component; MF, molecular function; BP, biological process.

