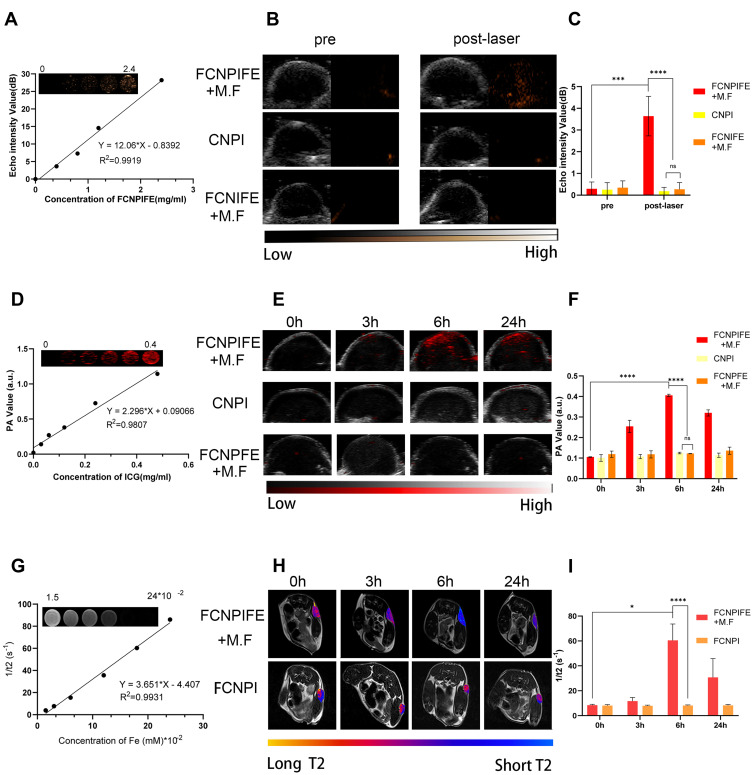
Figure 4.
USI, PAI and MRI in vitro and in vivo experiments. (A) In vitro US images and echo intensity value of FCNPIFE. (B) US images of tumors in Y79 tumor-bearing mice with injections of FCNPIFE, FCNIFE, and CNPI before /after 808nm laser irradiation. (C) Corresponding echo intensities within tumor regions before/after 808nm laser irradiation (n=3, **p < 0.01, ***p < 0.001). (D) In vitro PA images and PA value of FCNPIFE. (E) PA images of tumors in Y79 tumor-bearing mice after injections of FCNPIFE, CNPI and FCNPFE at different time points. (F) Corresponding PA intensities within tumor regions at different time points (n=3, ****p < 0.0001). (G) In vitro MRI and the transverse relaxivity (r2) of FCNPIFE. (H) T2 images of tumors in Y79 tumor-bearing mice after injections of FCNPIFE, FCNPI at different time points. (I) Corresponding signal intensities within tumor regions at different time points (n=3, *p < 0.05, ****p < 0.0001).

