Figure 5.
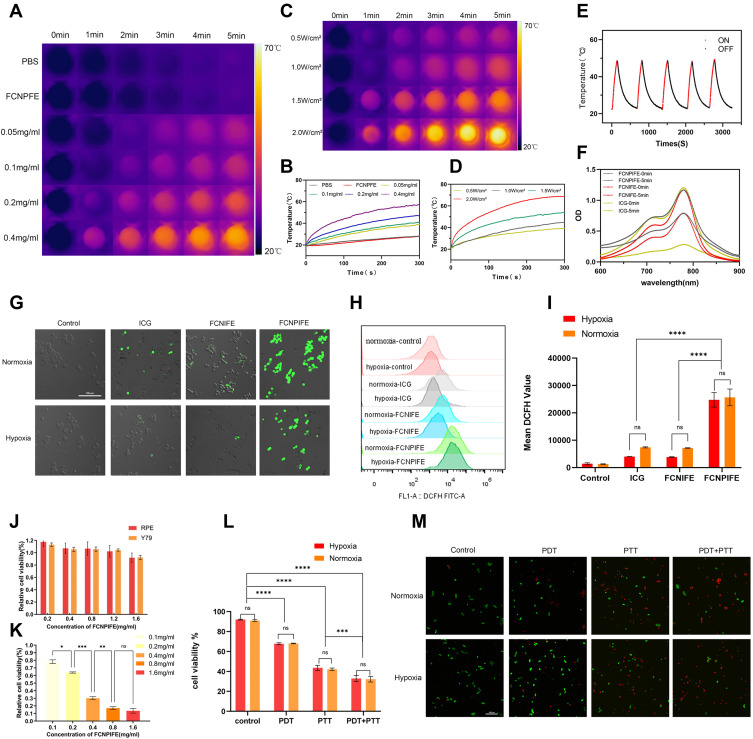
In vitro PTT, PDT performance and cytotoxicity of FCNPIFE. (A) Thermal images of PBS, FCNPFE and different concentrations of FCNPIFE under 808nm laser (1.5 W/cm2, 5 min). (B) Photothermal heating curves of PBS, FCNPFE and different concentrations of FCNPIFE under 808 nm laser (1.5 W/cm2, 5 min). (C) Thermal images of FCNPIFE (0.4 mg/mL) under different power of 808nm laser for 5 min. (D) Photothermal heating curves of FCNPIFE (0.4 mg/mL) under different power of 808nm laser for 5 min. (E) Photothermal stability of FCNPIFE under repeated five cycles of 808nm laser (1.5 W/cm2; on 30s, off 30s). (F) UV–vis–NIR spectra changes of FCNPIFE, FCNIFE and ICG before/after 5 min of irradiation (1.5 W/cm2). (G) CLSM images (scale bar: 100 μm) of intracellular ROS generated from ICG, FCNIFE and FCNPIFE under normoxic and hypoxic conditions. (H) The representative flow cytometry analysis of intracellular ROS generated from ICG, FCNIFE and FCNPIFE under normoxic and hypoxic conditions. (I) Quantitative flow cytometry analysis of ROS generated from ICG, FCNIFE and FCNPIFE in Y79 cells under normoxic and hypoxic conditions (n=3, ****p < 0.0001). (J) Cell viability of Y79 cells and ARPE-19 cells after incubated with different concentrations of FCNPIFE. (K) Cell viability of Y79 cells incubated with different concentrations of FCNPIFE after 5 min irradiation (n=3, *p < 0.05, **p < 0.01, ***p < 0.001). (I) Quantitative flow cytometry analysis of Y79 cells after PDT, PTT, and PTT+PDT under normoxic and hypoxic conditions (n=3, ***p < 0.001, ****p < 0.0001). (M) The Calcein-AM/PI staining images of Y79 cells after PDT, PTT, and PTT+PDT under normoxic and hypoxic conditions (scale bar: 100 μm).

