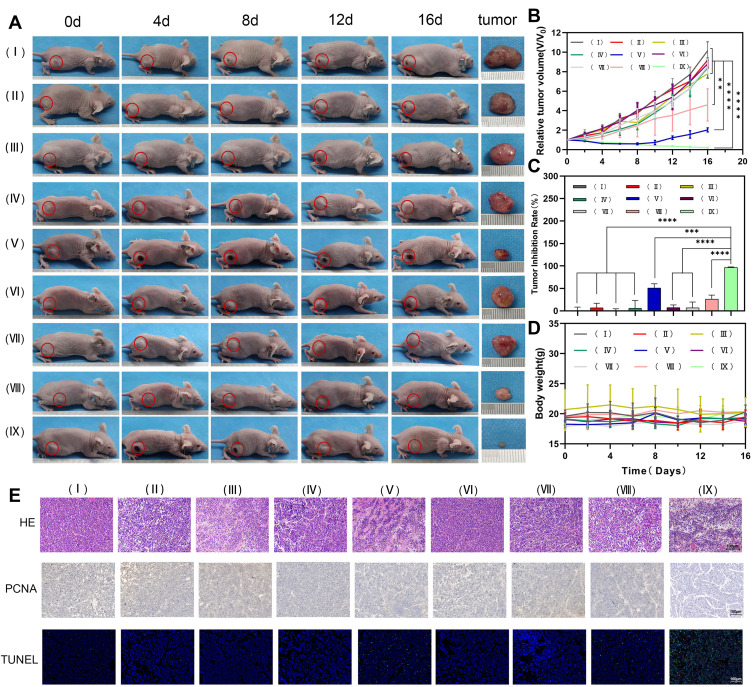
Figure 7.
In vivo therapeutic effects of different groups. (A) Representative digital images of tumor-bearing mice in different groups. group(I):saline, group(II):laser, group(III):FCNPIFE+M.F, group(IV):ICG+laser, group(V):FCNIFE+M.F+laser, group(VI): FCNPFE+M.F+laser, group(VII):CNPI+laser, group(VIII):FCNPIFE+M.F+intermittent laser, group(IX): FCNPIFE+M.F+laser. (B) Time-dependent relative tumor volume(V/V0) curves of mice in the different groups (n =3, **p < 0.01, ****p < 0.0001). (C) Tumor inhibition rates of nine groups after receiving different treatments. (n =3, ****p < 0.0001). (D) Body weight curves of Y79 tumor-bearing mice for each group during the 16d period. (E) HE, TUNEL, and PCNA staining results of different groups on the 3st day post treatments (scale bar:100μm).

