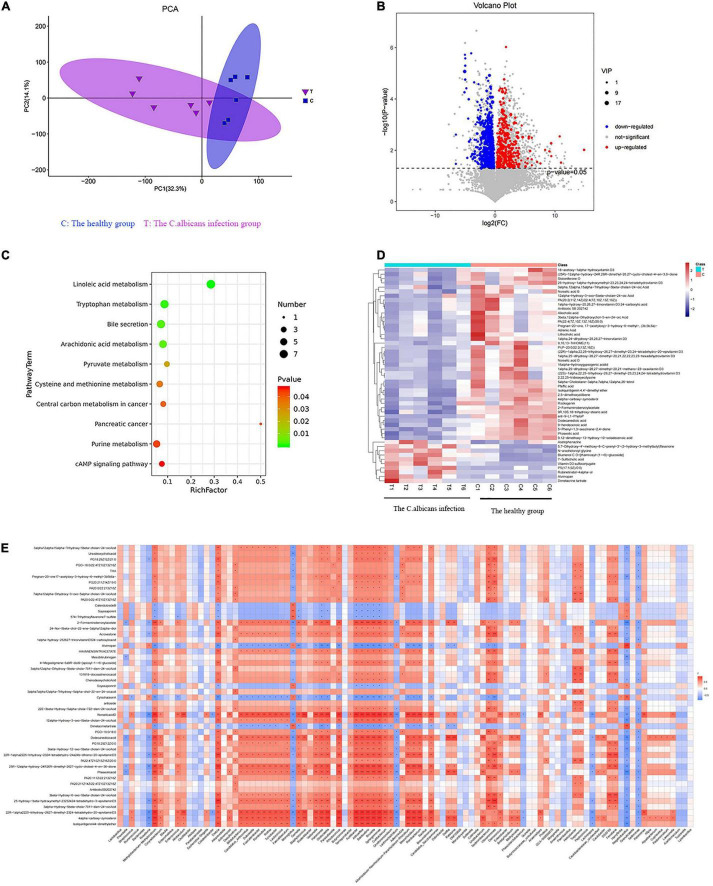
FIGURE 3.
Invasive C. albicans infection disrupts fecal metabolites in humans. (A) The PCA scatter plots of metabolomic analysis. (B) The volcano plot of differentially expressed metabolites. (C) The KEGG pathway enrichment analysis. (D) Heatmap of the top 50 differentially expressed metabolites. (E) Spearman correlation analysis. T, The Candida albicans infection group; C, The healthy control group.

