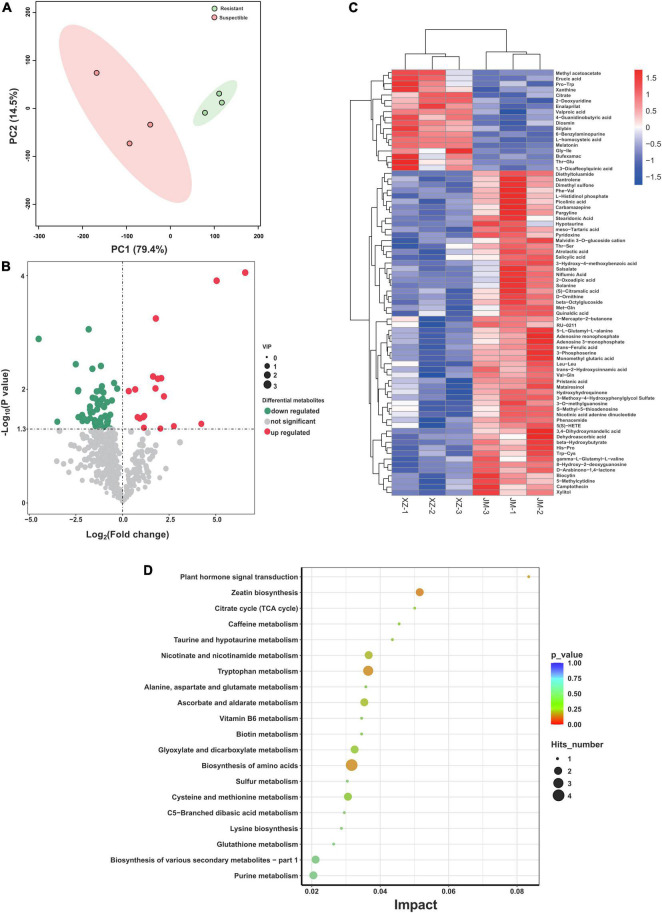
FIGURE 4.
Analysis of exudation profiles between resistant and susceptible cotton cultivars. (A) PCA plot of the root exudate profiles of two cotton cultivars. (B) The comparison of volcano plots of differentially expressed metabolites between the resistant and susceptible cultivars. (C) Heatmap of identified differentially expressed metabolites from resistant and susceptible samples. (D) Pathway enrichment analysis of differential metabolites from resistant and susceptible cultivars. XZ is the resistant cultivar and JM is the susceptible cultivar.

