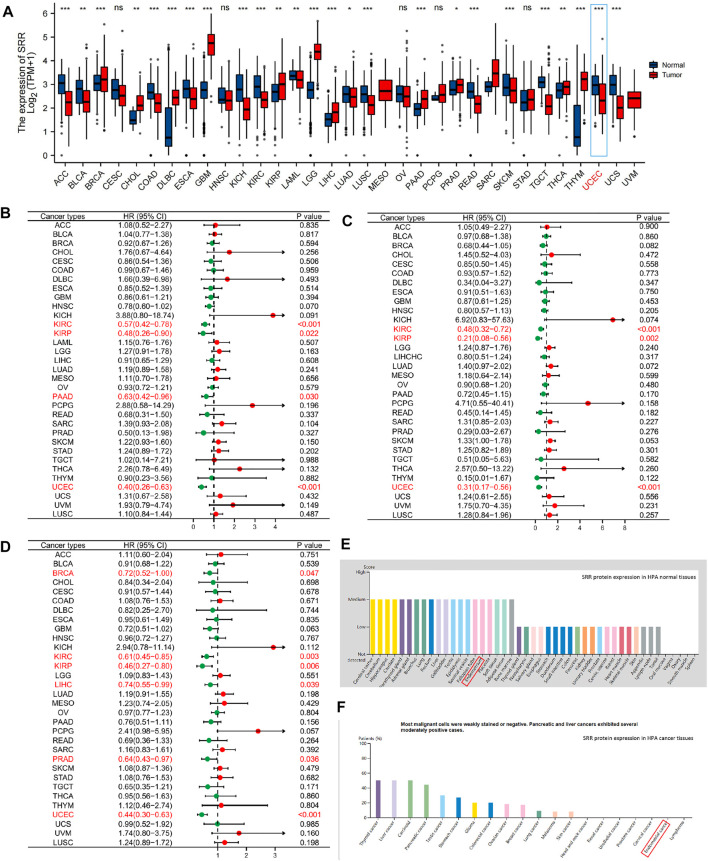
FIGURE 1.
Pan-cancer expression and survival analysis of SRR. (A) SRR mRNA expression levels in different types of cancer and their corresponding normal tissues. (B) Forest plot demonstrating the relation between SRR expression and OS. (C) Forest plot demonstrating the relation between SRR expression and DSS. (D) Forest plot demonstrating the relation between SRR expression and PFI. (E) SRR protein expression in HPA human normal tissues. (F) SRR protein expression in HPA human cancer tissues. In (A), * indicates p < 0.05, ** indicates p < 0.01, *** indicates p < 0.001, ns denotes not significantly different. In (B–D), red dots represent HR > 1, green dots represent HR < 1.

