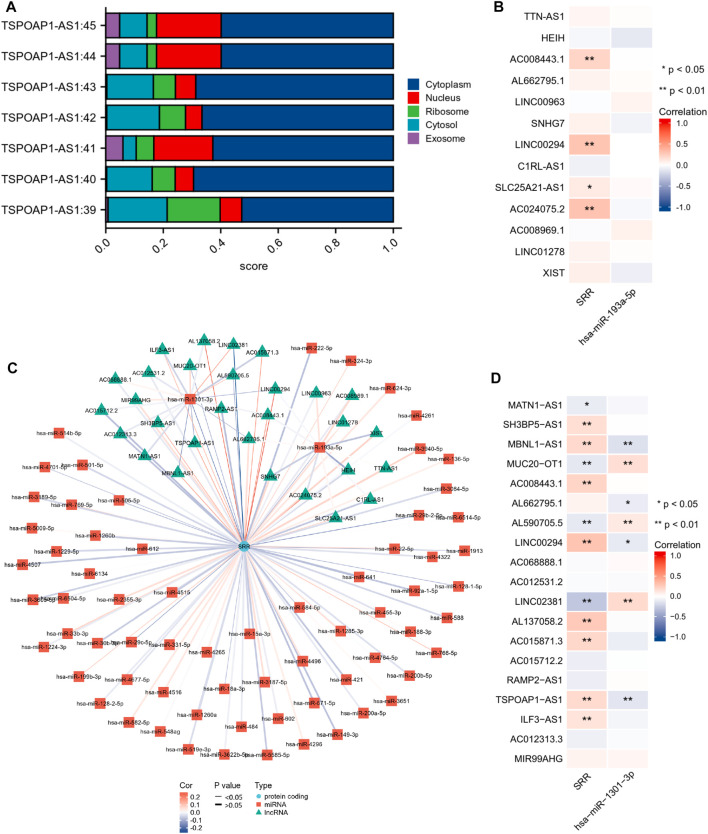
FIGURE 12.
Construction and correlation analysis of the ceRNA network. (A) Cellular localization of seven different transcripts of TSPOAP1-AS1 predicted using LncLocator. (B,D) Expression correlation analysis of the ceRNA network visualized through a heatmap. *p < 0.05, **p < 0.01. (C) LncRNAs-miRNAs-SRR interaction network.

