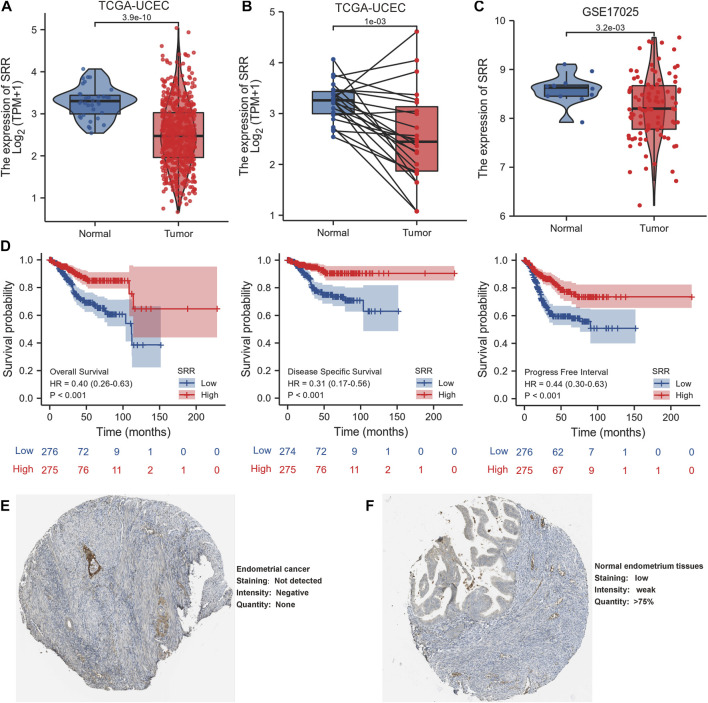
FIGURE 2.
Expression and prognostic value of SRR in UCEC. (A) SRR mRNA expression level in UCEC tissues (n = 552) compared with normal tissues (n = 35). (B) SRR mRNA expression is lower in UCEC tissues than in paired adjacent normal tissues (n = 23). (C) Validation of SRR expression by analyzing data from GSE17025. (D) OS, DSS, and PFI survival Kaplan-Meier curves of SRR in TCGA - UCEC patients. (E,F) Validation of SRR at the translational level using HPA database (immunohistochemistry).

