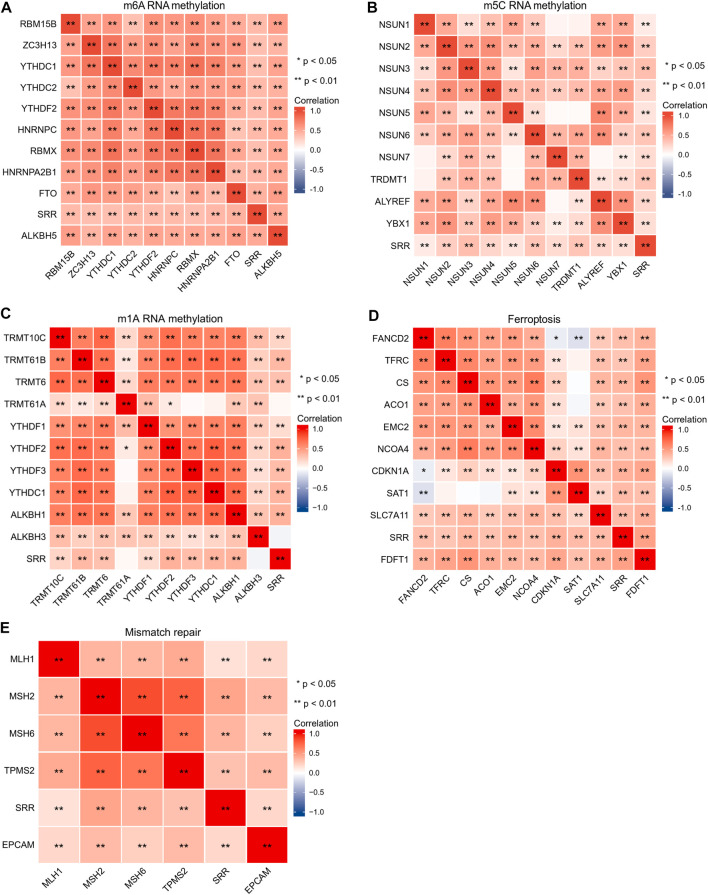
FIGURE 6.
Correlation analysis of SRR with m6A RNA methylation-related genes (A), m5C RNA methylation-related genes (B), m1A RNA methylation-related genes (C), ferroptosis-related genes (D), and mismatch repair-related genes (E) in UCEC. Red shows positive correlation, and blue shows negative correlation. The stronger the correlation, the darker the color. *p < 0.05, **p < 0.01.

