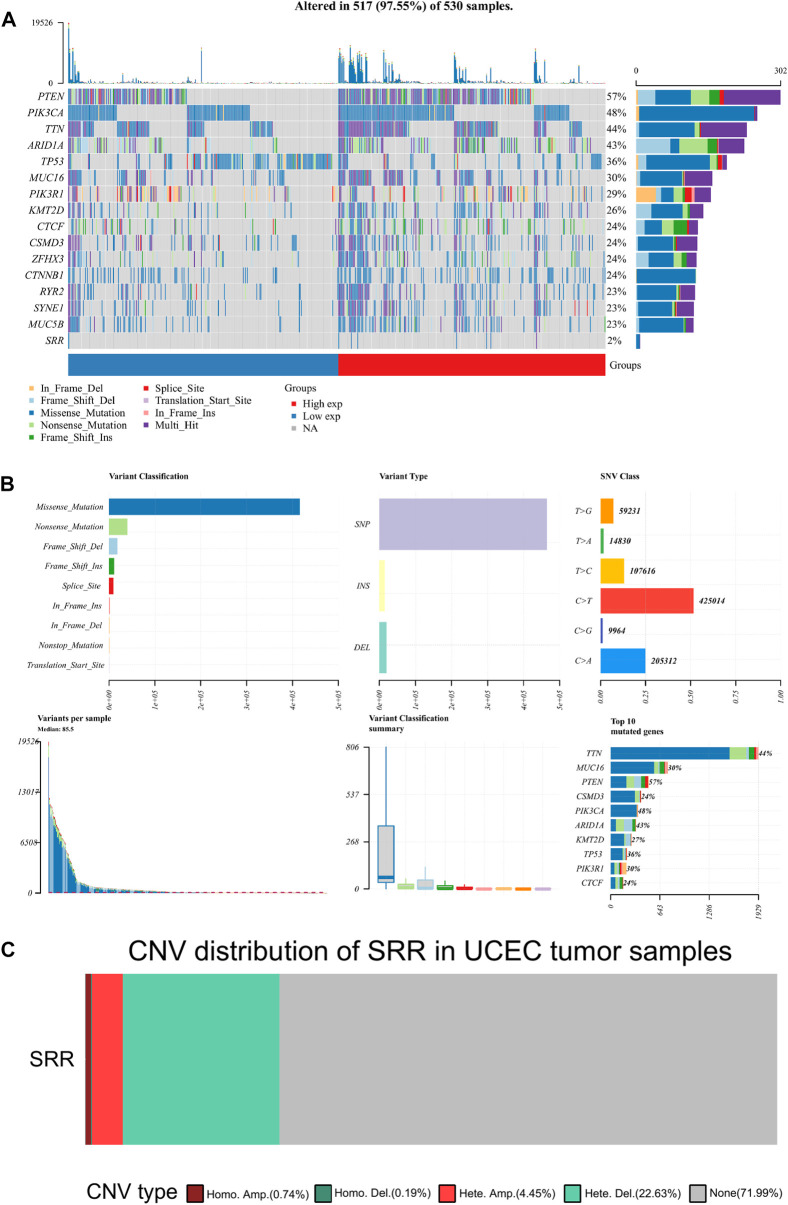
FIGURE 7.
Mutation and copy number variation of SRR in UCEC. (A) Oncoplot displaying the somatic landscape of the UCEC cohort. Genes are ordered by their mutation frequency, and samples are ordered according to SRR expression indicated by the annotation bar (bottom). The waterfall plot shows the mutation information of each gene within each sample. (B) Cohort summary plot displaying the distribution of variants according to variant classification, type, and SNV class. The lower part depicts mutation load for each sample and variant classification type. A stacked bar plot shows the top 10 mutated genes. (C) The distribution of SRR CNV type in UCEC patients. Different colors represent different CNV types.

