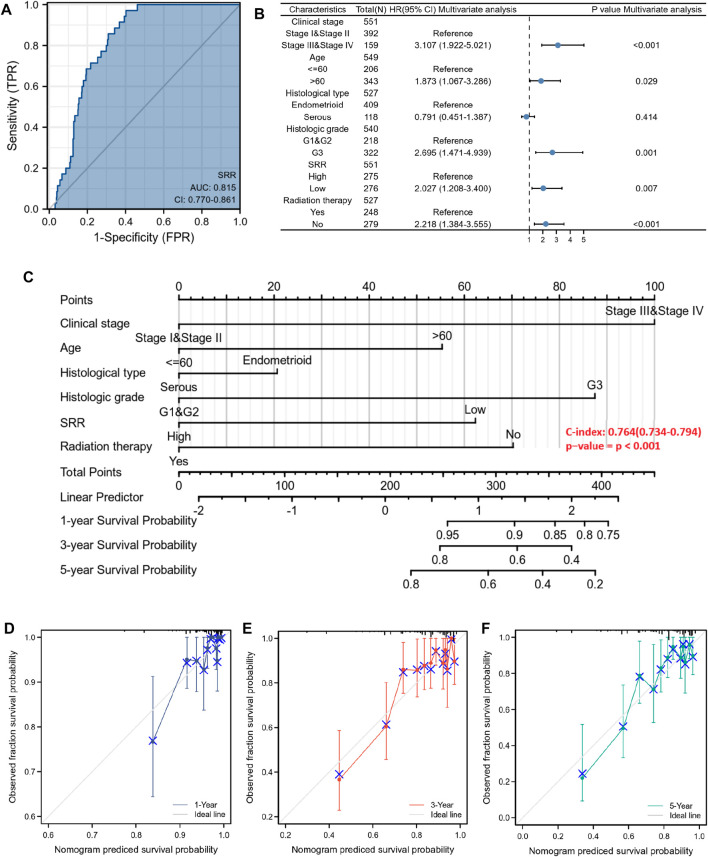
FIGURE 9.
Diagnostic and prognostic value of SRR in UCEC patients. (A) ROC analysis of SRR shows good discrimination power between tumor and normal tissues. (B) Forest plot shows the results of the multivariate Cox regression analysis of the clinicopathological characteristics affecting the OS of UCEC patients. (C) A nomogram for predicting the 1-, 3-, and 5-year OS probability for UCEC patients. (D–F) Calibration curves of 1-, 3-, and 5-year OS of UCEC patients. The ordinate represents the actual OS, while the abscissa represents the nomogram-predicted OS.

