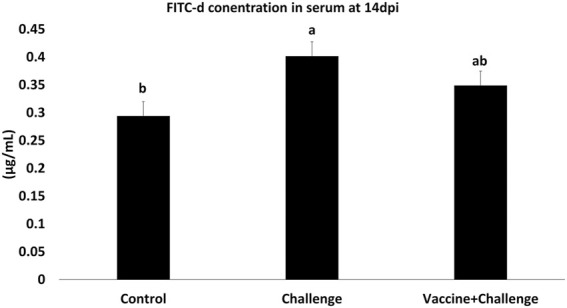
FIGURE 3.

FITC-d concentration in the serum of vaccinated birds. At d1 of age birds were allocated into treatment groups: 1) Control; 2) Challenge; or 3) Vaccine + Challenge. At d1 and d7 of age birds in the negative and positive control groups were mock vaccinated with PBS and birds in the treatment group were vaccinated with CNP. At d14 of age birds in the negative control group were given a mock challenge of 0.5 ml PBS/bird and birds in the positive control and the treatment group were orally challenged with 1 × 10⁷ CFU/bird of S. Enteritidis. At 14 dpi, one bird per pen was given 2.2 mg FITC-d by oral gavage. After 2 h blood samples were collected. The Optical Density (OD) was measured at 485 nm. Bars (+SE) with no common superscript differ (p < 0.05).
