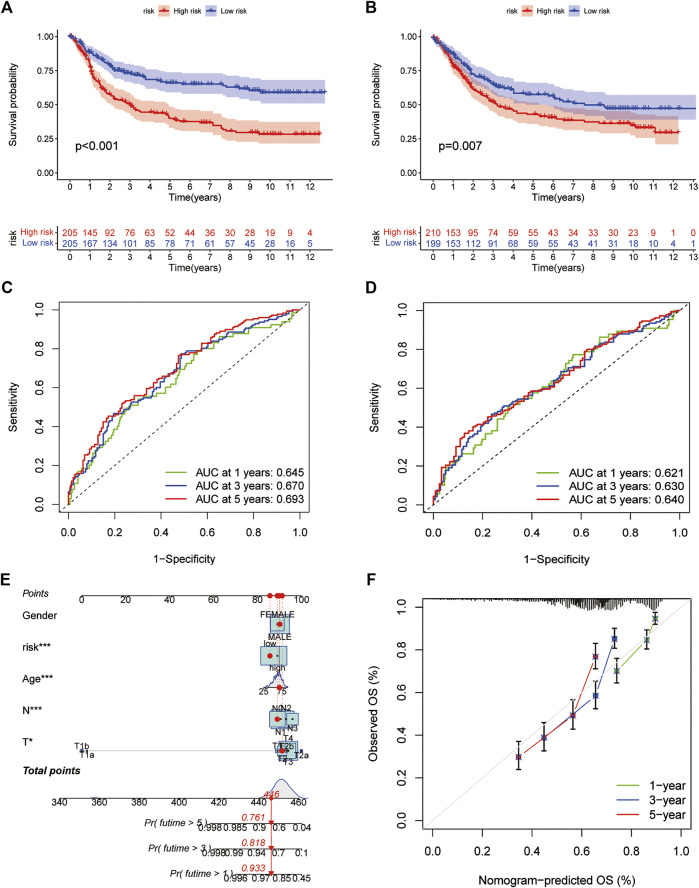
FIGURE 6.
Prediction model (A,B) Kaplan-Meier survival curves between the high- and low-risk groups in the training and test cohorts (C,D) ROC curves predicting 1-, three- and 5-years OS in the training and test cohorts of GC patients (E) Nomogram for predicting the 1-, three- and 5-years OS of GC patients (F) Calibration curves of the nomogram. ROC: receiver operating characteristic.

