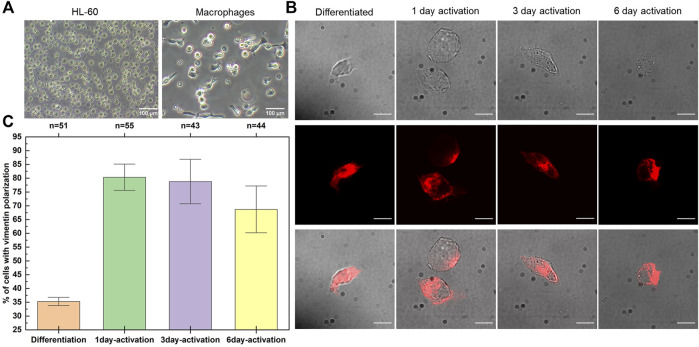
FIGURE 1.
Polarised expression of extracellular vimentin on the surface of TNF-α–activated macrophages. (A) Representative HL-60 cells before (left) and after (right) differentiation with TPA. (B) Representative non-permeabilised fixed samples of macrophages (Differentiated) stained with the V9 anti-vimentin antibody, showing expression of vimentin on their surface after 1, 3, and 6 days of TNF-α activation. Top row: Phase contrast images. Middle row: Fluorescent images for vimentin (red). Bottom row: Overlay of phase contrast and fluorescent images. Scale bar, 10 µm. (C) Quantification of the proportion of macrophages expressing extracellular cell-surface vimentin in a polarised manner over the 6 days of TNF-α activation. n denotes the total number of cells analyzed, error bars correspond to standard deviation.

