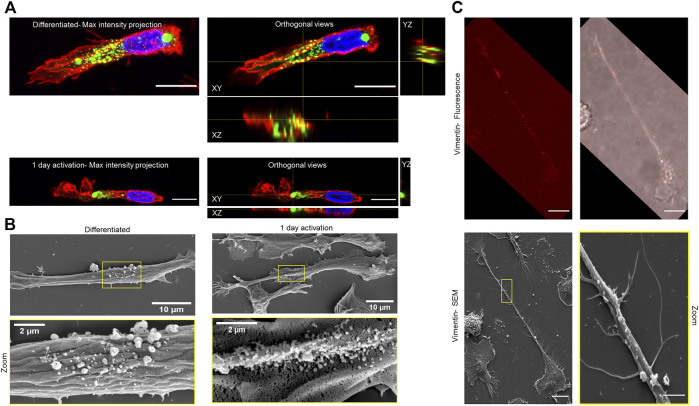
FIGURE 4.
Visualisation of surface vimentin on macrophages differentiated from GFP-vimentin HL60. (A) Maximum intensity projection and orthogonal views of differentiated and TNF-α–activated macrophage (red, membrane; green, surface vimentin; blue, nucleus), acquired with confocal microscopy. Scale bar, 10 µm. (B) Scanning electron microscopy images of vimentin secretion sites for the differentiated and TNF-α–activated macrophages. Bottom row: higher magnification of vimentin secretion site marked with yellow rectangle. This study was performed on 2D (glass coverslips) not on fibronectin coated 1D patterns. In order to have more residual cells after differentiation and activation, we used 1 day activation of both confocal LSM900 (A) and SEM imaging (B). (C) Confocal and SEM imaging using coverslips with grid. Top: Fluorescence images of vimentin (red; V9 antibody) stained in non-permeablized activated macropahges. Scale bar 10 μm. Bottom: SEM images of the same cell where the dot like structure can be seen at the same site of vimentin staining. Bottom (Right): magnified image of area marked in yellow of left. Scale bar 2 μm.

