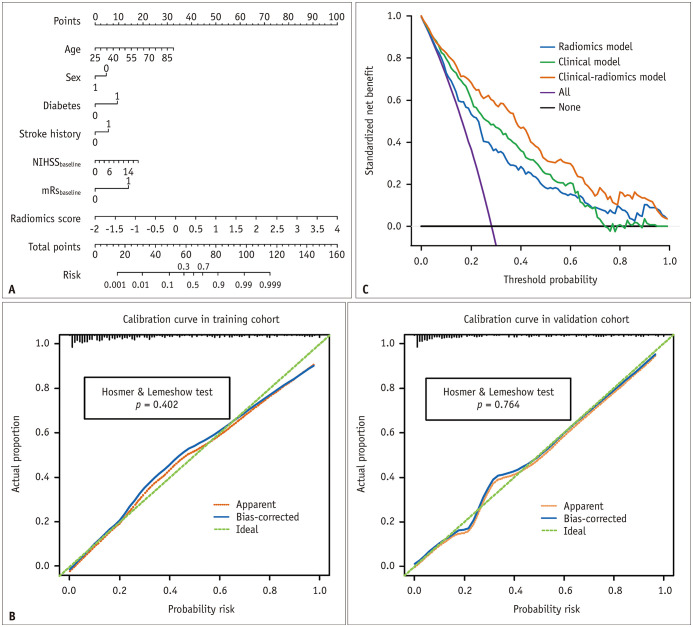
Fig. 3. The clinical-radiomics nomogram for predicting acute ischemic stroke outcomes.
A. The developed nomogram based on the clinical-radiomics prediction model to predict the risk of poor stroke outcome. Diabetes: 0, no diabetes; 1, diabetes. Sex: 0, female; 1, male. Stroke history: 0, no stroke history; 1, stroke history; mRSbaseline: 0, ≤ 2; 1, > 2. B. Calibration curves for the nomogram in the training and validation cohorts. The green dashed line represents the ideal prediction and the red dashed line represents the predictive ability of the nomogram. The closer the dashed red line fit to the dashed green line, the greater the prediction accuracy of the nomogram. C. Decision curve analysis for the nomogram. The black line represents the net benefit of assuming no stroke patients have poor outcomes. The purple line is the net benefit of assuming all stroke patients have poor outcome. The orange line, green line, and blue line represent the expected net benefit of predicting stroke outcome using the clinical-radiomics model, clinical model, and radiomics model respectively. mRSbaseline = baseline modified Rankin Scale score, NIHSSbaseline = baseline National Institutes of Health Stroke Scale score

