. 2022 Apr 19;304(2):406–416. doi: 10.1148/radiol.212137

Figure 2:

Examples of probability output on contrast-enhanced T1-weighted (left) and T2-weighted (right) MRI scans from the medulloblastoma (MB) test subset that did not participate in the model development. (A) Results of a staged primary classifier model are shown with probability outputs of non-wingless (WNT) and non–sonic hedgehog (SHH) and subsequent outputs of WNT and SHH generated from WNT and SHH. (B) Examples of tumors from an independent binary classifier model that differentiates between group 3 and group 4 are shown.

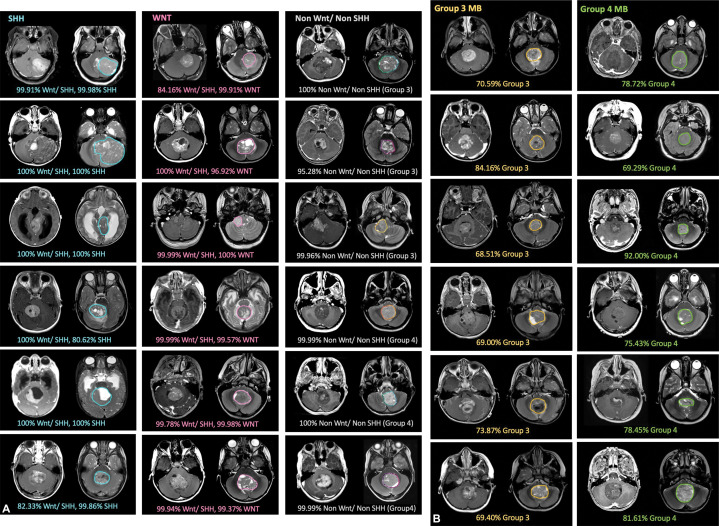
Examples of probability output on contrast-enhanced T1-weighted (left) and T2-weighted (right) MRI scans from the medulloblastoma (MB) test subset that did not participate in the model development. (A) Results of a staged primary classifier model are shown with probability outputs of non-wingless (WNT) and non–sonic hedgehog (SHH) and subsequent outputs of WNT and SHH generated from WNT and SHH. (B) Examples of tumors from an independent binary classifier model that differentiates between group 3 and group 4 are shown.