. 2022 Apr 19;304(2):406–416. doi: 10.1148/radiol.212137

Figure 5:

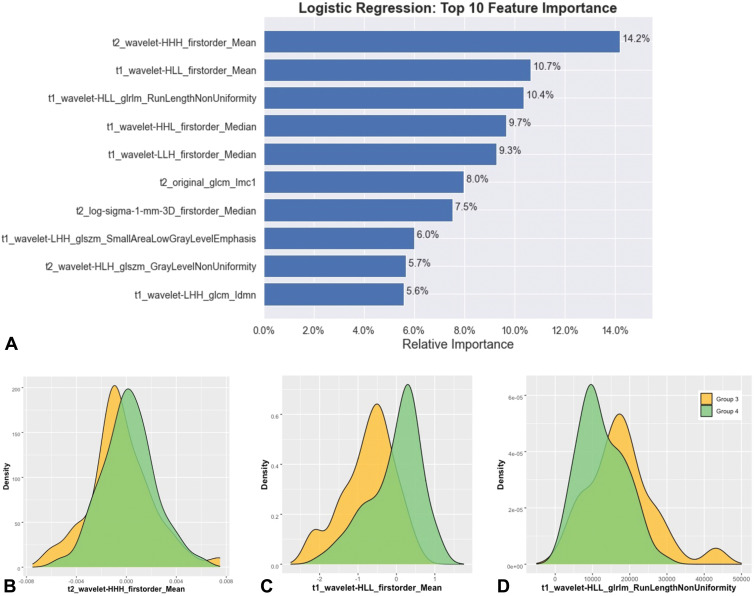
(A) Bar plot shows the relative influence as calculated by logistic regression of the top 10 reduced features for the follow-up binary classifier trained to distinguish group 3 from group 4. (B–D) Density plots of the top three Image Biomarker Standardization Initiative features, including (B) T2-Mean, (C) T1-Mean, and (D) T1-Run Length Nonuniformity.

(A) Bar plot shows the relative influence as calculated by logistic regression of the top 10 reduced features for the follow-up binary classifier trained to distinguish group 3 from group 4. (B–D) Density plots of the top three Image Biomarker Standardization Initiative features, including (B) T2-Mean, (C) T1-Mean, and (D) T1-Run Length Nonuniformity.