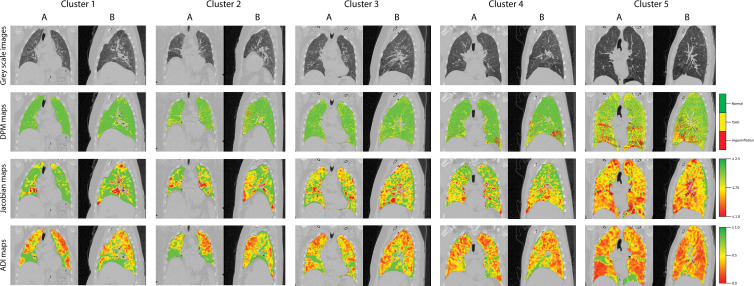
Figure 3:
Representative (A) coronal and (B) sagittal gray-scale CT scans, disease probability maps (DPMs), Jacobian maps, and anisotropic deformation index (ADI) images from noncontrast CT scans in patients in the Severe Asthma Research Program III cohort according to cluster. For DPMs, green voxels represent normal lung tissue, yellow voxels represent functional air trapping, and red voxels represent hyperinflation. For Jacobian and ADI maps, voxels are represented on a gradient from green to yellow to red. For Jacobian maps, green voxels represent Jacobian values greater than or equal to 2.5, yellow voxels represent a Jacobian value of 1.75, and red voxels represent Jacobian values less than or equal to 1.0. For ADI maps, green voxels represent ADI values greater than or equal to 1.0, yellow voxels represent an ADI of 0.5, and red voxels represent an ADI of 0. fSAD = functional small airway disease.

