. 2022 Apr 26;304(2):450–459. doi: 10.1148/radiol.210363

Figure 4:

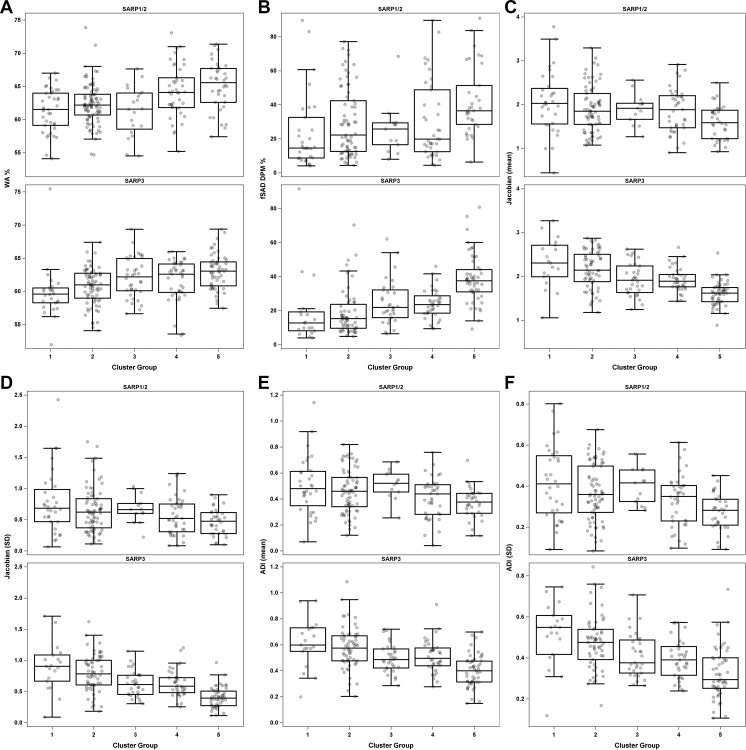
Box plots of means and SDs for key quantitative CT (qCT) measurements between clusters in Severe Asthma Research Program (SARP) I and II and SARP III, including (A) wall area (WA) percentage, (B) functional small airway disease (fSAD) on disease probability maps (DPM), (C) mean Jacobian, (D) SD of Jacobian, (E) mean anisotropic deformation index (ADI), and (F) SD of ADI.

Box plots of means and SDs for key quantitative CT (qCT) measurements between clusters in Severe Asthma Research Program (SARP) I and II and SARP III, including (A) wall area (WA) percentage, (B) functional small airway disease (fSAD) on disease probability maps (DPM), (C) mean Jacobian, (D) SD of Jacobian, (E) mean anisotropic deformation index (ADI), and (F) SD of ADI.