. 2022 Apr 26;304(2):419–428. doi: 10.1148/radiol.210385

Figure 3:

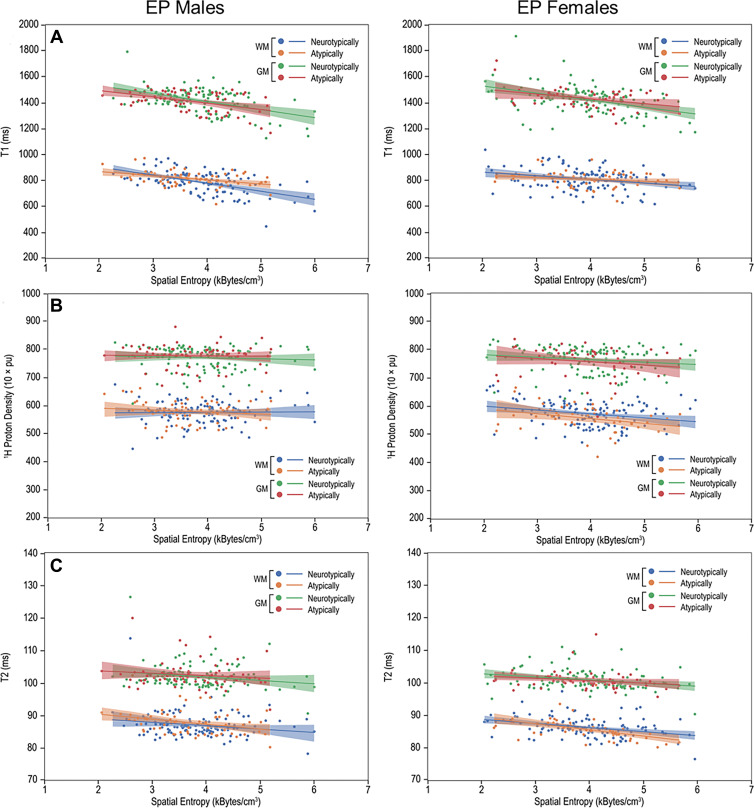
Multiparametric quantitative MRI parameters versus spatial entropy density (SEd). Scatterplots and linear fitting of the mean (A) T1, (B) normalized proton density, and (C) T2 values versus SEd of the white matter (WM) and gray matter (GM) for neurotypically and atypically developing extremely preterm (EP)–born adolescents. Differences in the associations of T1 and SEd were observed in the WM between atypically and neurotypically developing boys. pu = percent unit.

Multiparametric quantitative MRI parameters versus spatial entropy density (SEd). Scatterplots and linear fitting of the mean (A) T1, (B) normalized proton density, and (C) T2 values versus SEd of the white matter (WM) and gray matter (GM) for neurotypically and atypically developing extremely preterm (EP)–born adolescents. Differences in the associations of T1 and SEd were observed in the WM between atypically and neurotypically developing boys. pu = percent unit.