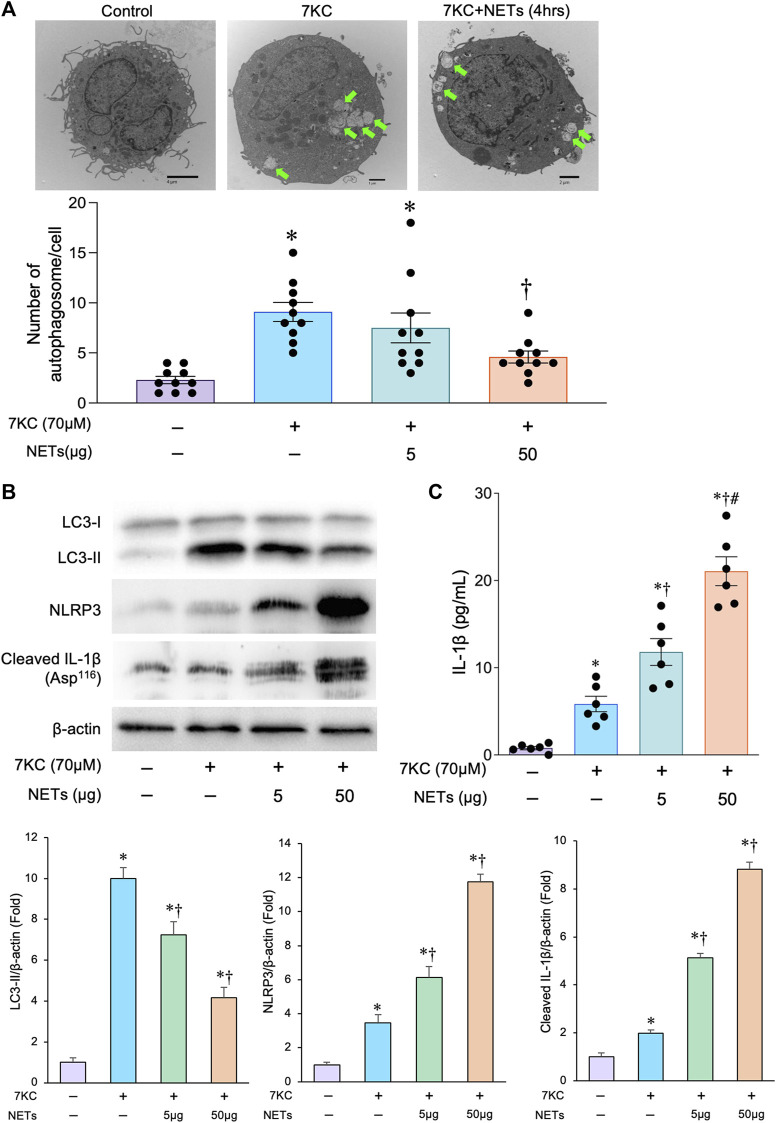
FIGURE 2.
Effects of 7KC and NETs on macrophage autophagy in-vitro. (A) Upper panels: Representative transmission electron microscopic images of autophagosomes (arrows) in the macrophages differentiated from THP-1 cells with and without the administration of 7KC and or NETs. Lower panel: Quantitative analysis of the number of autophagosomes with and without the administration of 7KC and or NETs. *p < 0.05 vs. control group (Purple bar), † p < 0.05 vs. 7KC-treated group (Blue bar), n = 10 in each group. Data are expressed as dot plots and bars, with lines indicating the mean ± SEM. (B) Upper panel: Representative immunoblot images of LC3, NLRP3, cleaved IL-1β, and β-actin. Lower panels: Densitometric analysis of immunoblots. *p < 0.05 vs. control group (Purple bar), † p < 0.05 vs. 7KC-treated group (Blue bar), n = 3 in each group. All data are expressed as mean ± SEM. (C) Macrophages differentiated from the THP-1 cells with and without the administration of the 7KC and or NETs were analyzed for IL-1β secretion in the supernatants by the ELISA. *p < 0.05 vs. control group (Purple bar), † p < 0.05 vs. 7KC-treated group (Blue bar), # p < 0.05 vs. 7KC + NETs (5 μg)-treated group (Green bar), n = 6 in each group. Data are expressed as dot plots and bars, with lines indicating the mean ± SEM.

