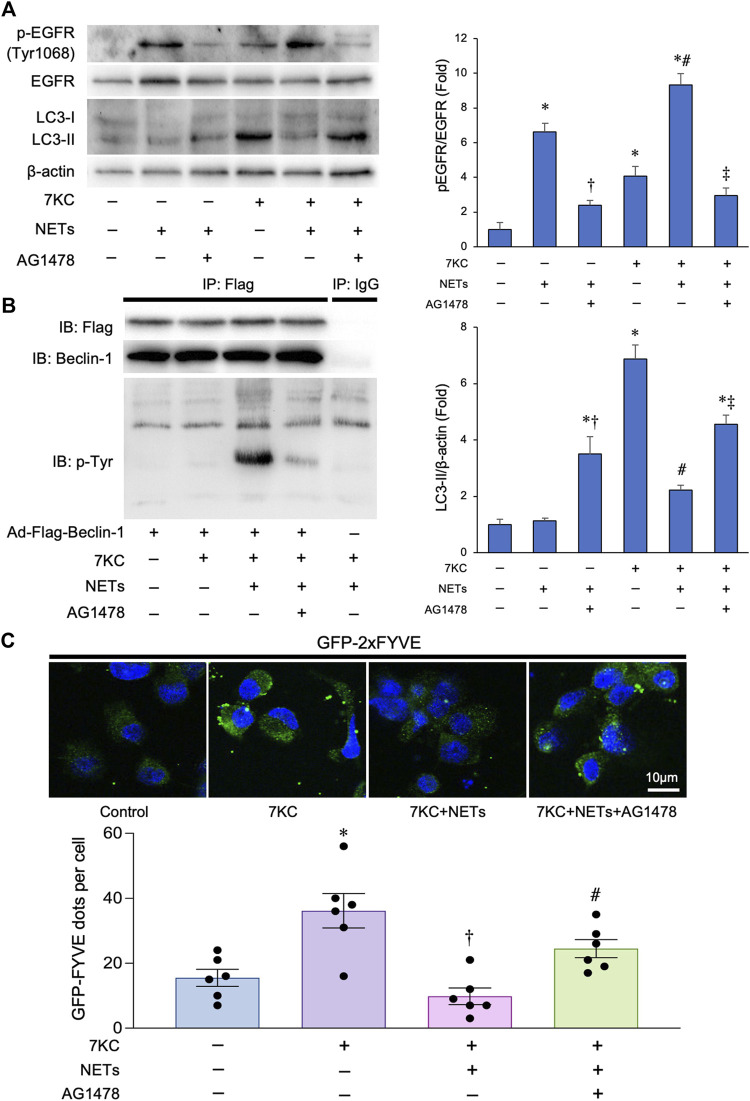
FIGURE 4.
Effects of NETs for Beclin 1 phosphorylation and Beclin 1-associated PI3-K activation in macrophages. (A) Left panel: Representative immunoblot images of LC3, EGFR, phospho-EGFR (Tyr1068), and β-actin. Right panels: Densitometric analysis of immunoblots. *p < 0.05 vs. control group, † p < 0.05 vs. NET-treated group, # p < 0.05 vs. 7KC-treated group, ‡ p < 0.05 vs. 7KC + NET-treated group, n = 3 in each group. All data are expressed as mean ± SEM. (B) Macrophages derived from the THP-1 cells were treated with a 7KC after Ad-Flag-Beclin-1 transduction and then treated with or without the NETs or AG1478, a potent EGFR tyrosine kinase inhibitor. 48 h after the transduction, lysates were extracted for co-immunoprecipitation with phospho-Tyrosine-specific antibody or control IgG, followed by probing with Beclin-1 antibody. Representative images are shown. (C) Membrane-associated phosphoinositide 3-kinase (PI3-K) assay in-situ. Macrophages derived from the THP-1 cells were treated with a 7KC after Ad-GFP-2×FYVE transduction, and then treated with or without NETs or AG1478. Upper: Representative images of GFP-2×FYVE dots are shown. Lower: Quantitative analysis of the number of GFP-2×FYVE dots is shown. *p < 0.05 vs. control group (Blue bar), † p < 0.05 vs. 7KC-treated group (Purple bar), # p < 0.05 vs. 7KC + NETs-treated group (Pink bar), n = 6 in each group. Data are expressed as the dot plots and bars, with the lines indicating the mean ± SEM.

