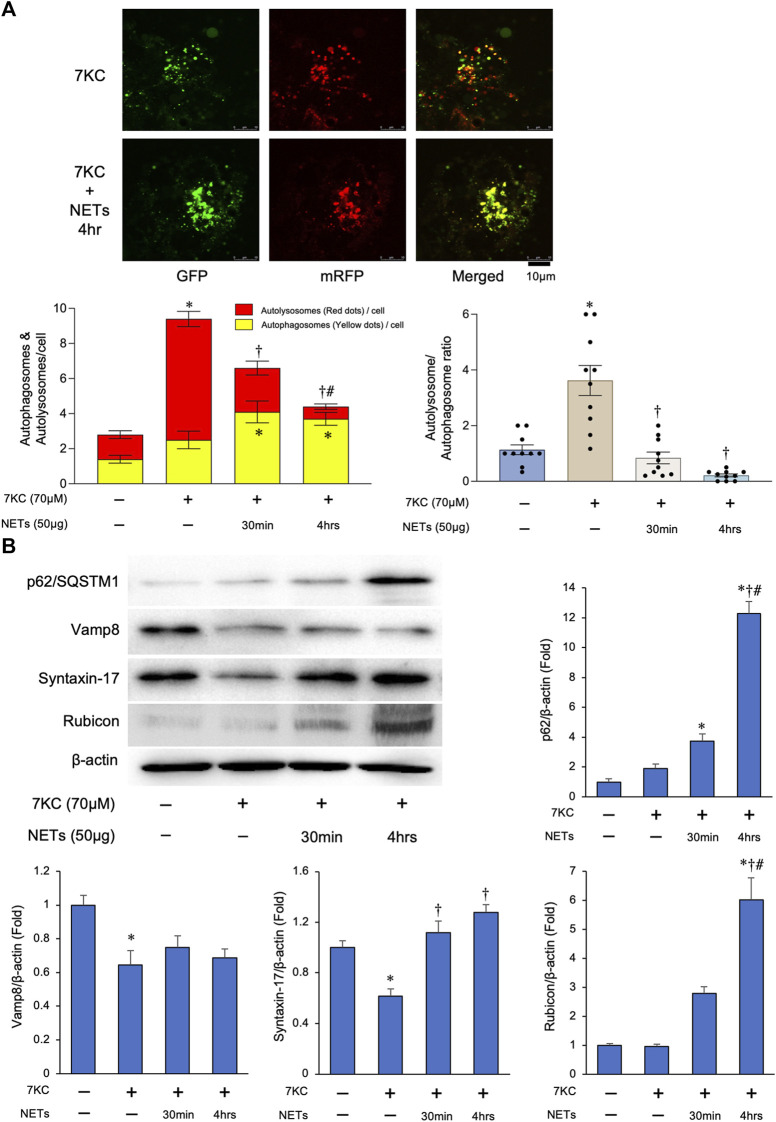
FIGURE 5.
NETs negatively regulate autophagosome–lysosome fusion through upregulating Rubicon expression. (A) Autophagy flux assay. Macrophages derived from the THP-1 cells were treated with a 7KC after Ad-tf-LC3 transduction and then treated with or without the NETs. Upper panels: Representative images of the fluorescent LC3 puncta. Puncta with a yellow color in the merged images indicate the autophagosomes, and puncta with red color in the merged images indicate autolysosomes. Left lower panel: Quantitative analysis of the mean number of autophagosomes represented by the yellow puncta in the merged images and autolysosomes represented by the red puncta in the merged images per cell is shown. *p < 0.05 vs. control group, † p < 0.05 vs. 7KC-treated group, # p < 0.05 vs. 7KC + NETs (30 min)-treated group, n = 10 in each group. Data are expressed as the bars, with the lines indicating the mean ± SEM. Right lower panel: Quantitative analysis of the mean autophagosome/autolysosome ratio per cell is shown. *p < 0.05 vs. control group (Blue bar), † p < 0.05 vs. 7KC-treated group (Brown bar), n = 10 in each group. Data are expressed as dot plots and bars, with lines indicating the mean ± SEM. (B) Left upper panel: Representative immunoblot images of the p62/SQSTM1, Vamp8, Syntaxin-17, Rubicon, and β-actin. Right and Lower panels: Densitometric analysis of immunoblots. *p < 0.05 vs. control group, † p < 0.05 vs. 7KC-treated group, # p < 0.05 vs. NET (30 min)-treated group, n = 3 in each group. All data are expressed as mean ± SEM.

