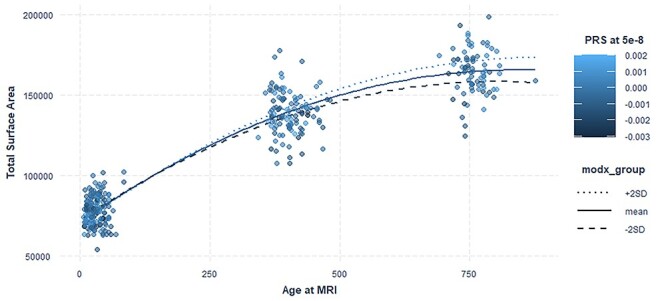
Figure 3.

PRS testosterone–age interaction and total surface area. PRS for serum testosterone significantly moderated age-related differences in surface area growth in females. Plot shows quadratic mixed effect regression line for the effect of PRS at threshold 5 × 10⁻⁸ with age. modx_group shows the values for PRS for which the lines are plotted. Actual data points are plotted as scatterplot on top of the interaction lines and the color of the dots are based on the PRS scores of the subjects.
