
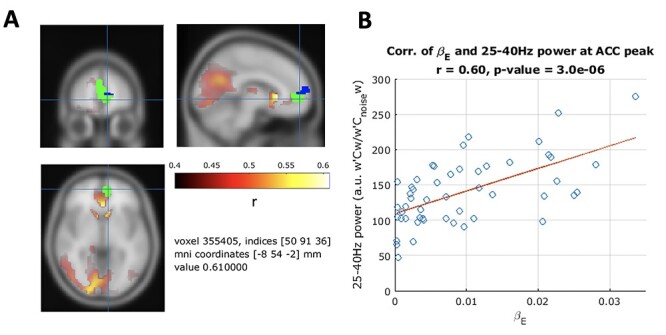
Figure 6.
Subject level analysis: subject level expectation weight  significantly (
 , 5000 random permutations) correlates with subject average beta-gamma power preceding mood rating. Color bar indicates Pearson’s correlation (r) for MEG power. Source map showing significantly correlated clusters has been masked with cortical and subcortical regions included in the AAL atlas. Subject beta-gamma power shows significant correlation clusters in subgenual ACC, caudate and occipital cortex. Voxels of overlap between MEG and fMRI results (Keren et al. 2021) are displayed in green and voxels where only fMRI showed significant correlation are in blue. Both modalities show a subject level brain activity correlating with
  in ACC regions.