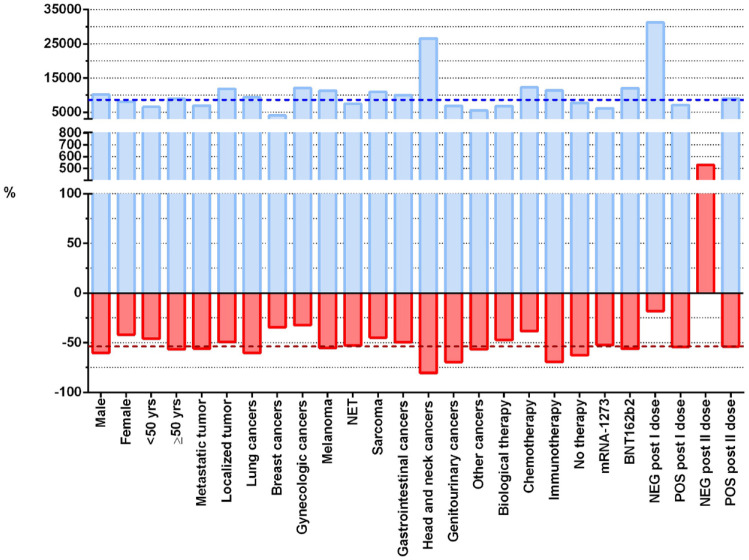
Figure 3.
Percentage changes in the antibody levels between T1, T2 and T2, T3. Each blue and red bar represents the median percentage change between T2 and T1 or between T3 and T2, respectively, in each category of the variables of interest. The blue and red dotted reference lines indicate the overall median percentage change for the T2 − T1 and T3 − T2 differences, respectively.

