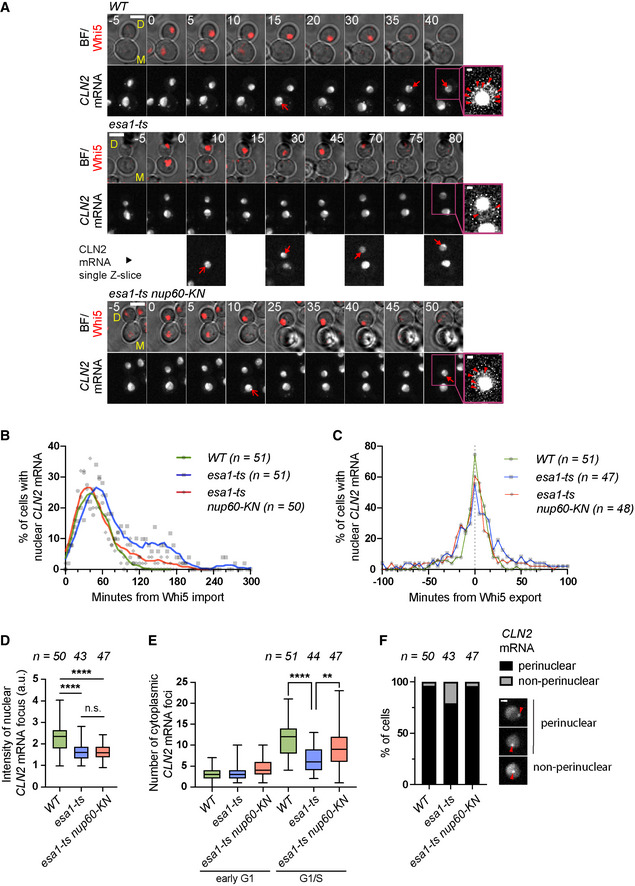
Figure 3. Esa1 and Nup60‐KN promote the nuclear export of CLN2 mRNA.

-
AComposite of bright field and Whi5‐tdTomato (BF/Whi5) and CLN2‐PP7 mRNA labelled with PCP‐NLS‐GFP (CLN2 mRNA) in mother (M) and daughter (D) cells of the indicated strains. Arrows indicate nuclear foci. Brighter GFP nucleoplasmic areas may correspond to the nucleolus. Insets show enhanced‐contrast images to visualise cytoplasmic mRNA particles (arrowheads). Numbers indicate minutes relative to Whi5 nuclear import. Maximum projections of whole‐cell Z‐stacks are shown for Whi5 and CLN2 mRNA except in the inset and in selected esa1‐ts images, where single Z‐slices are shown for clarity. Scale bar, 4 μm (inset: 1 μm).
-
BFraction of cells of the indicated strains with nuclear CLN2‐PP7 mRNA foci, aligned relative to Whi5 import. Symbols represent individual values; lines were generated by smoothing of the nearest three neighbouring values (0th order polynomial).
-
CFraction of cells of the indicated strains with nuclear CLN2‐PP7 mRNA foci, aligned relative to Whi5 export.
-
DMean fluorescence intensity of nuclear CLN2 mRNA foci at the time of Whi5 export, normalised relative to the nuclear background.
-
ENumber of cytoplasmic CLN2‐PP7 mRNA foci in early G1 (5 min after Whi5 import) and at the G1/S transition (5 min after Whi5 export).
-
FThe position of nuclear CLN2‐PP7 foci (marked with arrowheads in the examples) was scored relatively to the nuclear periphery (visualised with PCP‐NLS‐GFP) in the indicated strains. The fraction of non‐perinuclear CLN2‐PP7 foci is significantly increased in esa1‐ts cells compared to the WT and rescued by nup60‐KN mutation (two‐sided Fisher's exact test, P = 0.0209 and P = 0.0227). Scale bar, 1 μm.
Data information: In (D and E), boxes include 50% of data points, lines represent the median, and whiskers extend to maximum and minimum values. ****, P ≤ 0.0001; **, P ≤ 0.01; and n.s., P > 0.05, ordinary one‐way ANOVA with Tukey's multiple comparisons test. Adjusted P‐values in (D): WT vs. esa1‐ts, P < 0.0001; WT vs. esa1‐ts nup60‐KN, P < 0.0001; and esa1‐ts vs. esa1‐ts nup60‐KN, P = 0.9845; and in (E): WT vs. esa1‐ts, P < 0.0001; and esa1‐ts vs. esa1‐ts nup60‐KN, P = 0.002. Foci were scored in individual Z‐slices spanning the entire cell volume. n = number of cells, pooled from two independent experiments with similar results.
Source data are available online for this figure.
