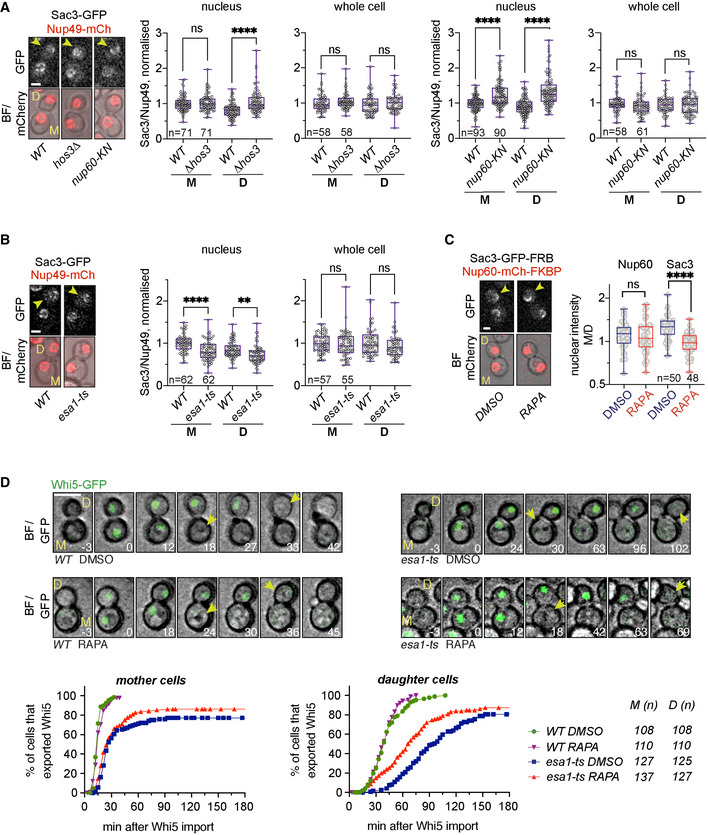
Figure 5. Nup60 deacetylation in daughter cells displaces Sac3 from NPCs and delays Start.

-
ADepletion of Hos3 or expression of acetyl‐mimic Nup60 (nup60‐KN) increases the nuclear localisation of Sac3 in G1. Cells of the indicated strains were imaged by time‐lapse microscopy, and the fluorescence levels of the indicated proteins were determined in G1 (after cytokinesis). The NPC component Nup49 was used as a control for nuclear pore complex protein levels. Fluorescence intensity was measured in sum projections of whole‐cell Z‐stacks, by segmentation of either the nuclear area in the mCherry channel or the whole cell in the bright‐field channel. The ratio of Sac3 to Nup49 intensities was then normalised relative to the mean intensity of wild‐type mothers.
-
BInactivation of Esa1 decreases Sac3 nuclear levels. Wild‐type (WT) and esa1‐ts cells were arrested in mitosis by treatment with nocodazole at 25°C, shifted to 37°C, released from the mitosis block in fresh medium at 37°C and imaged by time‐lapse microscopy. Fluorescence levels were quantified in G1 as in (A).
-
CRapamycin‐dependent dimerisation abolishes Sac3 mother/daughter asymmetries. NUP60‐mCherry‐FKBP SAC3‐GFP‐FRB cells were incubated with rapamycin (RAPA) to trigger FRB‐FKBP heterodimerisation, or with DMSO as control. Fluorescence levels were quantified in G1 cells as in (A), 15 to 30 min after addition of the drug.
-
DSac3 anchoring to the nuclear basket advances Start in esa1‐ts daughter cells. Composite of bright field and Whi5‐mGFP (top) and quantification of Whi5 nuclear export timing (bottom) in wild‐type (WT) and esa1‐ts mother (M) and daughter (D) cells treated with either rapamycin (RAPA) or DMSO and expressing Nup60‐FRB and Sac3‐mCherry‐FKBP. Sac3 anchoring to Nup60 does not alter Whi5 export timing in WT mother or daughter cells (DMSO vs. RAPA, P > 0.05, log‐rank Mantel–Cox test), but it advances Whi5 export in esa1‐ts daughters (P = 0.0001). Whi5 export efficiency was slightly improved also in mother cells (P = 0.0374). 8 z‐confocal slices spaced 0.4 μm were acquired every 3 min; maximum projections are shown. Time is indicated in minutes; t = 0 marks Whi5 nuclear import. Scale bar, 5 μm.
Data information: In (A–C), arrowheads point to daughter cells, and in (D), to Whi5 export. In (A–C), boxes include 50% of data points, the line represents the median, and whiskers extend to maximum and minimum values. ****, P ≤ 0.0001; **, P ≤ 0.01; and ns, P > 0.05, two‐tailed unpaired t‐test. Scale bar, 2 μm. n = number of cells, pooled from three independent experiments with similar results.
Source data are available online for this figure.
