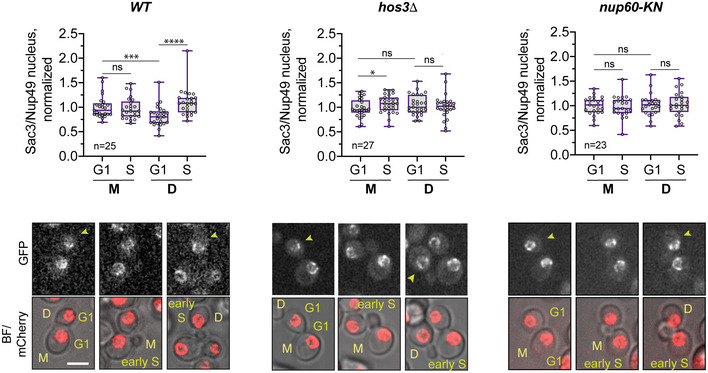
Figure EV5. Sac3 recruitment to daughter cell nuclei in G1 and S phase.

Cells of the indicated strains were imaged by time‐lapse microscopy, and the fluorescence levels of Sac3‐GFP and Nup49‐mCherry were determined in G1 (unbudded cells after cytokinesis) and S phase (cells with small buds). The NPC component Nup49 was used as a control for nuclear pore complex protein levels. Fluorescence intensity was measured in sum projections of whole‐cell Z‐stacks, by segmentation of the nuclear area in the mCherry channel. The ratio of Sac3 to Nup49 intensities was then normalised relative to the mean intensity of wild‐type mothers. Boxes include 50% of data points, the line represents the median, and whiskers extend to maximum and minimum values. ****, P ≤ 0.0001; ***, P < 0.001, *, P ≤ 0.05; and ns, P > 0.05, two‐tailed paired t‐test. Scale bar, 4 μm. n = number of cells, pooled from three independent experiments with similar results. Arrows point to daughter cells.
Source data are available online for this figure.
