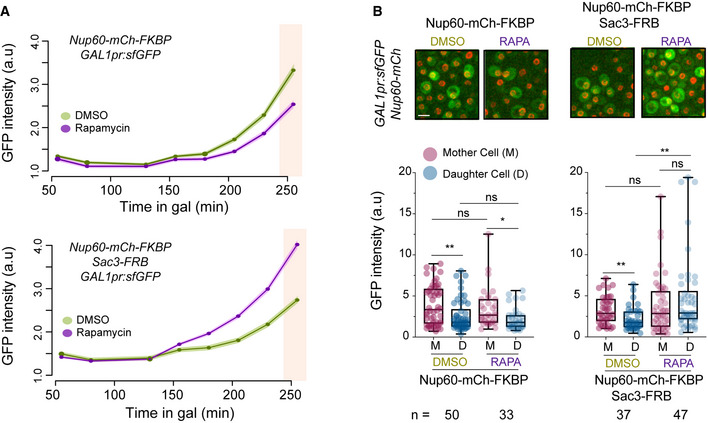
Figure 7. Sac3 anchoring to Nup60 promotes GAL1 expression.

-
ACells of the indicated strains were incubated with galactose in the presence of either rapamycin (RAPA) to induce FRB‐FKBP heterodimerisation, or DMSO as control. GAL1pr:sfGFP expression was monitored over time as in Fig 6B.
-
B(Top) Representative images of the indicated cells in rapamycin or DMSO, 250 min after galactose addition. Scale bar, 4 μm. (Bottom) Mother/daughter pairs were quantified as in Fig 6D at 250 min after galactose addition (pink shaded area in A). Boxes include 50% of data points, the line represents the median, and whiskers extend to maximum and minimum values. **, P ≤ 0.01; *, P ≤ 0.05; and ns, P > 0.05, two‐tailed paired t‐test for M‐D comparisons, unpaired for comparisons between strains. n = number of cells. One of two independent experiments with similar results is shown.
Source data are available online for this figure.
