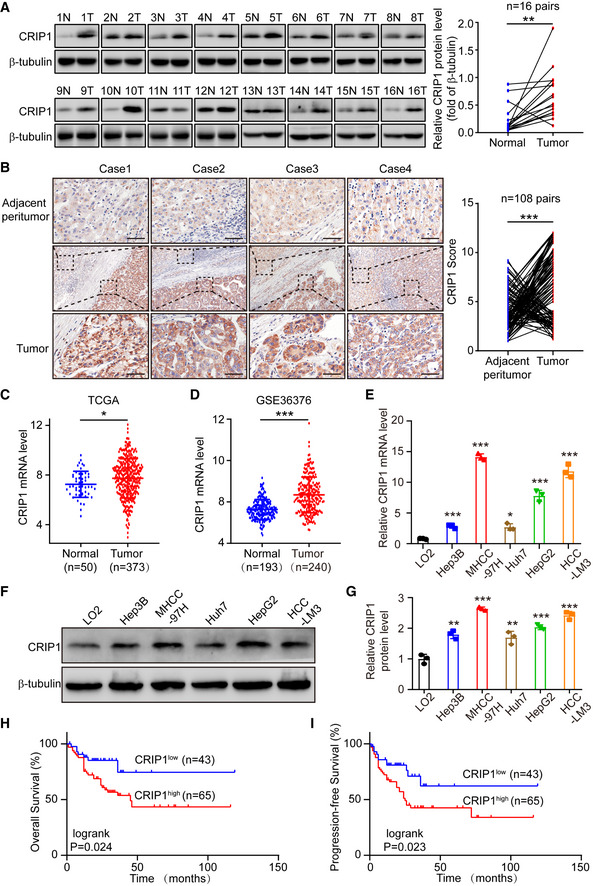
Figure 1. CRIP1 is upregulated in HCC and associated with poor survival.

-
AWestern blot analysis of CRIP1 protein expression in 16 paired HCC tumor tissues (T) and adjacent nontumor tissues (N). The graph represents CRIP1 protein expression normalized to GAPDH levels (right).
-
BRepresentative IHC images of CRIP1 protein expression in 108 paired HCC tumor tissues and adjacent nontumor tissues. Scale bars: 20 μm. Statistical analysis of immunohistochemical score of CRIP1 expression in HCC tumor tissues and paired adjacent tissues (right).
-
CCRIP1 mRNA expression in the TCGA‐LIHC dataset.
-
DmRNA levels of CRIP1 in the GSE36376 dataset from the GEO database.
-
E, FThe mRNA (E) and protein (F) levels of CRIP1 in HCC cell lines and normal LO2 hepatocytes.
-
GRelative CRIP1 protein level compared to normal LO2 hepatocytes.
-
H, IKaplan–Meier survival analyses of OS (H) and PFS (I) based on CRIP1 expression levels in 108 HCC patients.
Data information: Data represent the mean ± SD of at least three independent experiments. *P < 0.05, **P < 0.01, and ***P < 0.001. Differences were tested using a two‐tailed, paired (A, B) and unpaired (C–E, G) Student's t‐test and the log‐rank test (H, I).
