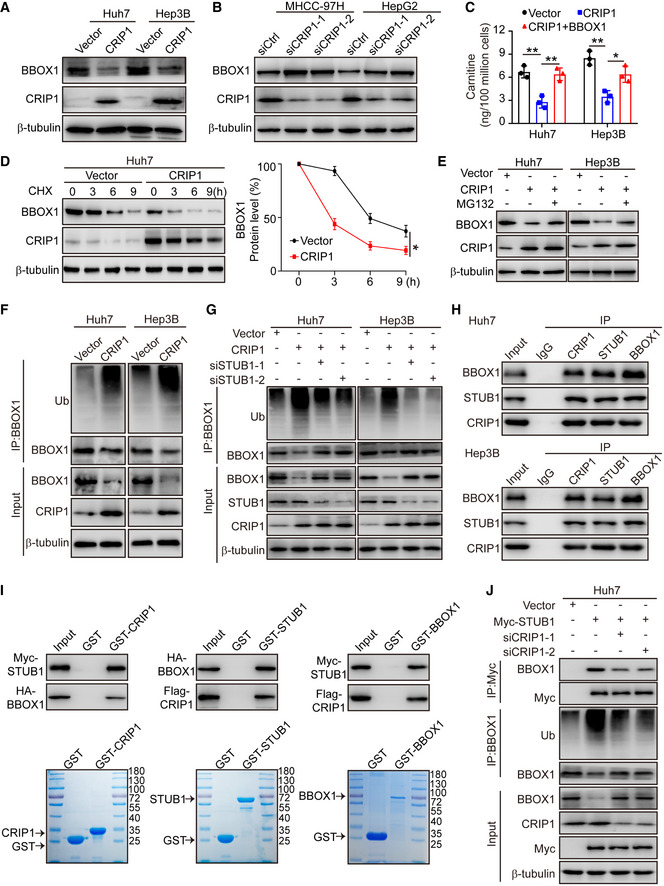
Figure 4. CRIP1 promotes STUB1‐mediated degradation of BBOX1.

-
AWestern blot analysis of BBOX1 protein levels in CRIP1‐overexpressing Huh7 and Hep3B cells.
-
BWestern blot analysis of BBOX1 protein levels in CRIP1 knockdown MHCC‐97H and HepG2 cells.
-
CELISA showing carnitine levels in CRIP1‐overexpressing Huh7 and Hep3B cells transfected with BBOX1.
-
DWestern blot analysis of BBOX1 in CRIP1‐overexpressing Huh7 cells treated with CHX (100 μg/ml) for the indicated durations (left). The graph shows quantification of relative BBOX1 levels (right).
-
EWestern blot analysis of BBOX1 protein levels in CRIP1‐overexpressing Huh7 and Hep3B cells treated with MG132 (10 μM) for 10 h.
-
FCo‐immunoprecipitation and immunoblot analyses of BBOX1 ubiquitination in CRIP1‐overexpressing Huh7 and Hep3B cells.
-
GCo‐immunoprecipitation and immunoblot analyses of BBOX1 ubiquitination in CRIP1‐overexpressing Huh7 and Hep3B cells transfected with STUB1 siRNAs.
-
HCo‐immunoprecipitation and immunoblot analyses of the interaction among endogenous CRIP1, STUB1, and BBOX1 in Huh7 and Hep3B cells.
-
IGST pulldown assay analysis of the association of CRIP1 with BBOX1 and STUB1.
-
JCo‐immunoprecipitation and immunoblot analyses of the interaction between STUB1 and BBOX1 and BBOX1 ubiquitination in Huh7 cells transfected with STUB1‐Myc and CRIP1 siRNAs.
Data information: Data represent the mean ± SD of at least three independent experiments. *P < 0.05 and **P < 0.01. Differences were tested using an unpaired two‐tailed Student's t‐test (C, D).
