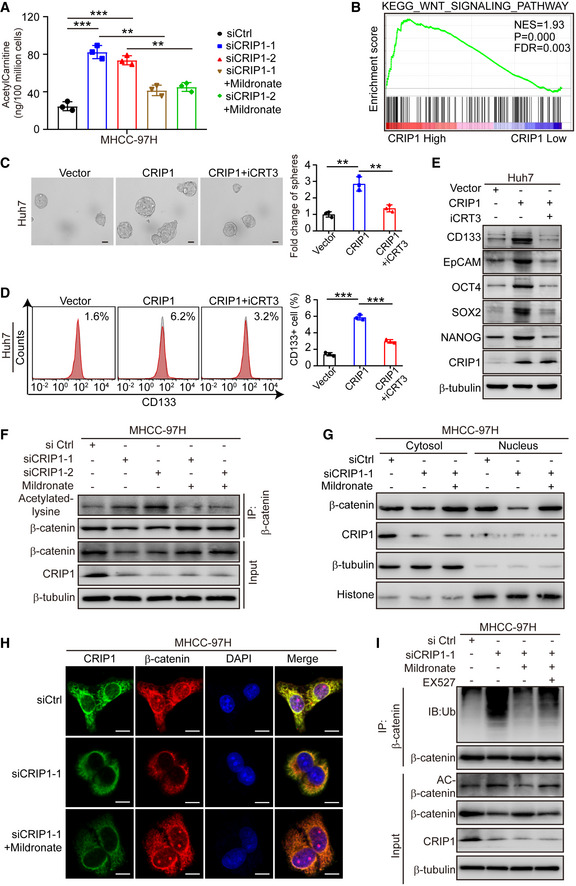
Figure 6. CRIP1 activates the Wnt/β‐catenin pathway by decreasing β‐catenin acetylation.

-
AELISA analysis of acetylcarnitine levels in CRIP1‐knockdown cells treated with mildronate (5 mM) for 24 h.
-
BGSEA based on CRIP1 expression in the TCGA‐LIHC database.
-
C, DRepresentative images of tumor sphere formation and quantification of spheres (C) and flow cytometric analysis of the proportion of CD133+ cells (D) in CRIP1‐overexpressing Huh7 cells with or without iCRT3 (50 μM) for 24 h. Scale bar: 50 μm.
-
EWestern blot analysis of HCC cancer stem cell markers in CRIP1‐overexpressing Huh7 cells with or without iCRT3 (50 μM) for 24 h.
-
FCo‐immunoprecipitation and immunoblot analyses of β‐catenin acetylation in CRIP1 knockdown MHCC‐97H cells treated with mildronate (5 mM) for 24 h.
-
GWestern blot analysis of cytoplasmic and nuclear fractions of β‐catenin in CRIP1 knockdown MHCC‐97H cells treated with mildronate (5 mM) for 24 h.
-
HConfocal microscopy images of β‐catenin in CRIP1 knockdown MHCC‐97H cells treated with mildronate (5 mM) for 24 h. Scale bar: 10 μm.
-
ICo‐immunoprecipitation and immunoblot analyses of β‐catenin ubiquitination in CRIP1 knockdown MHCC‐97H cells treated with mildronate (5 mM) and EX527 (20 μM) for 24 h.
Data information: Data represent the mean ± SD of at least three independent experiments. **P < 0.01 and ***P < 0.001. Differences were tested using an unpaired two‐tailed Student's t‐test (A, C and D).
