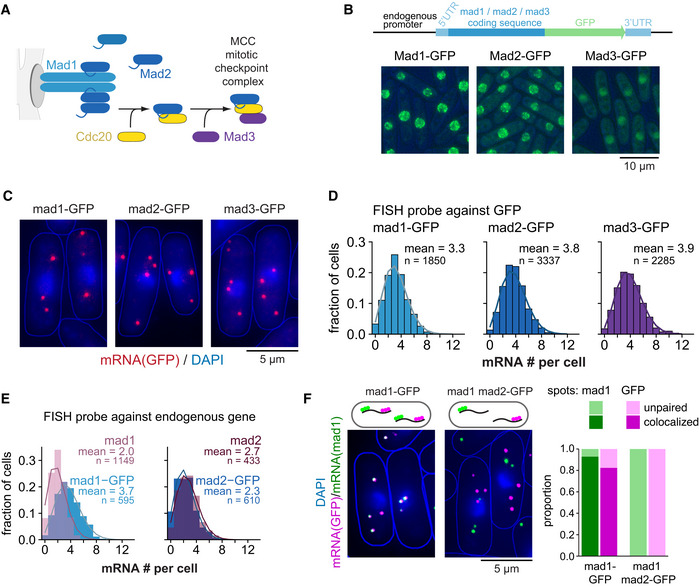
Figure 1. Low steady‐state mRNA numbers of checkpoint genes mad1 +, mad2 +, and mad3 + .

-
AOverview of the interactions between Mad1, Mad2, and Mad3.
-
BSchematic of marker‐less GFP‐tagging at the endogenous locus and representative live‐cell images of Mad1‐, Mad2‐, and Mad3‐GFP strains (average intensity projections).
-
CRepresentative images of single‐molecule mRNA FISH (smFISH) staining of S. pombe using probes against GFP (red). DNA was stained with DAPI (blue). The gamma‐value was adjusted to make the cytoplasm visible; cell shapes are outlined in blue.
-
DFrequency distribution of mRNA numbers per cell determined by smFISH; combined data from 3, 4, and 5 experiments, respectively, shown separately in Fig EV1C; n, number of cells. Curves show fit to a Poisson distribution.
-
EFrequency distribution of mRNA numbers per cell using FISH probes against the endogenous genes and using either strains expressing the GFP‐tagged gene or the endogenous, untagged gene. Curves show fit to a Poisson distribution. The difference for mad1 + is statistically significant, that for mad2 + is not (Fig EV1E). A lower mRNA number for untagged mad1 + was also observed in an independent strain.
-
FCo‐staining by smFISH using probes against mad1 + and GFP either in a strain expressing mad1 +‐GFP as a positive control or in a strain expressing wild‐type mad1 + and mad2 +‐GFP. Cytoplasmic mad1 + (green) or GFP mRNA spots (magenta) were quantified as co‐localizing or not with the respective other. For the mad1 +‐GFP strain, 544 cells and a total of 1,641 mad1 spots and 1,839 GFP spots were analyzed; 48 cells were not considered as they did not contain at least one spot of each type in the cytoplasm. For the mad1 + mad2 +‐GFP strain, 571 cells and a total of 1,107 mad1 spots and 1,537 GFP spots were analyzed; 158 cells were not considered since they did not contain at least one spot of each type in the cytoplasm.
Source data are available online for this figure.
