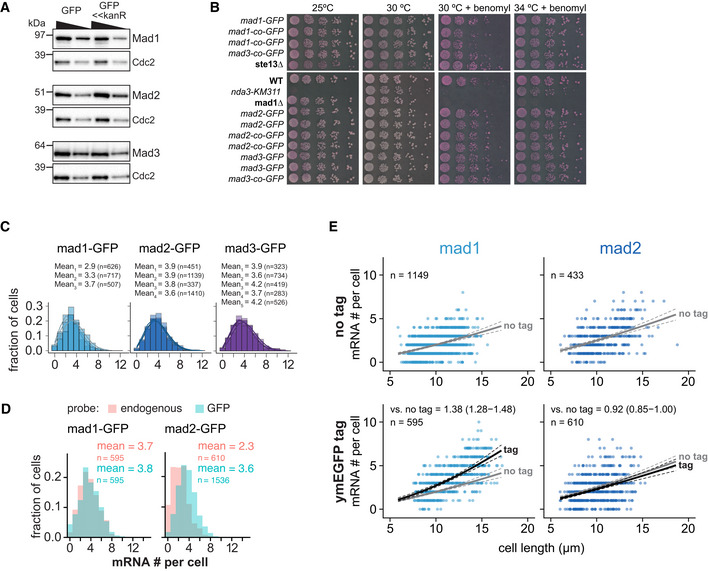
Figure EV1. Additional data on Mad1, Mad2, and Mad3 tagging and mRNA numbers.

-
AImmunoblot comparing expression of mad1 +, mad2 +, and mad3 + tagged at the endogenous locus either by marker‐less insertion of yeast codon‐optimized monomeric enhanced GFP (ymEGFP, here: GFP) or conventionally with GFP‐S65T and a kanamycin‐resistance cassette (GFP<<kanR). Antibodies against the endogenous proteins were used. Cdc2 was probed as loading control. A 1:1 dilution is loaded in the second lane for each sample.
-
BGrowth assay for the indicated strains on rich medium plates without (left side) or with benomyl (right side). The agar contains Phloxine B, which stains dead cells.
-
CFrequency distribution of mRNA numbers per cell. Data from individual experiments which are shown combined in Fig 1. Probes were against the GFP portion of each fusion gene. Curves show fit to a Poisson distribution.
-
DFrequency distribution of mRNA numbers per cell using probes against the endogenous gene or against GFP in strains expressing a GFP fusion of either mad1 + or mad2 +. The comparison illustrates that for mad2 +‐GFP either the endogenous probe is less sensitive, or there is considerable mRNA degradation from the 5′ end leading to fewer detected spots with a probe on the endogenous gene than on the 3′ end GFP tag.
-
ESame experiment as Fig 1E. Scatter plots of whole‐cell mRNA counts versus cell length. Solid lines are regression curves from generalized linear mixed model fits (gray for no tag, black for GFP‐tagged gene). Dashed lines represent 95% bootstrap confidence bands for the regression curves. Model estimates of the ratio of tagged to untagged mRNA levels with bootstrap 95% confidence intervals are included in the plots. One experiment with probes against mad1 + or mad2 + coding sequences, respectively.
Source data are available online for this figure.
