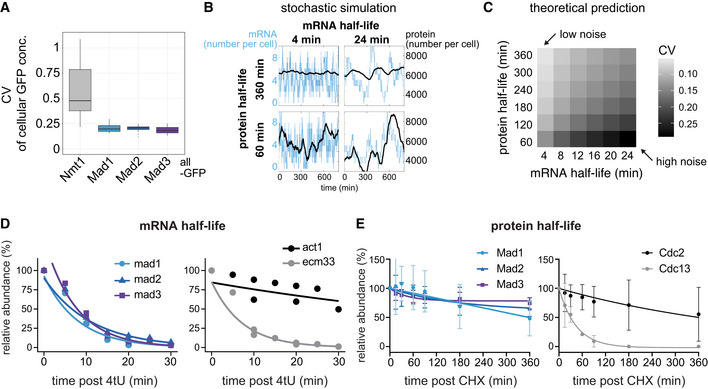
Figure 2. The checkpoint genes mad1 +, mad2 +, and mad3 + combine short mRNA and long protein half‐lives, explaining low noise.

-
ACellular protein noise (coefficient of variation, CV = std / mean) in live‐cell microscopy images of S. pombe; n = 7 images (Nmt1‐GFP), 11 (Mad1‐GFP), 19 (Mad2‐GFP), 10 (Mad3‐GFP); single images had 16–79 GFP‐positive and 6–94 GFP‐negative (control) cells. Boxplots show median and interquartile range (IQR); whiskers extend to values no further than 1.5 times the IQR from the first and third quartile, respectively. Mad1, Mad2, and Mad3 all showed significantly lower noise than Nmt1 (Wilcoxon rank sum test; all P < 0.001).
-
BSimulations of stochastic gene expression noise from selected mRNA/protein half‐life combinations assuming a constantly active promoter (see Methods). Synthesis rates were set to obtain a mean mRNA number of 4 per cell, and a mean protein number of 6,000 per cell. The x‐axis of each graph shows time, the y‐axis shows mRNA number per cell (blue) or protein number per cell (black).
-
CTheoretical prediction for the coefficient of variation (CV = std/mean) of the protein number per cell, assuming different mRNA and protein half‐lives, using the same underlying model as in B. Synthesis rates were adjusted to maintain a mean mRNA number per cell of 3.5, and a mean protein number per cell of 6,000 (approx. 100 nM).
-
DmRNA abundances by qPCR following metabolic labeling and removal of the labeled pool (two independent experiments). Lines are regression curves from generalized linear mixed model fits, excluding the measurements at t = 0 in order to accommodate for noninstantaneous labeling by 4tU. Act1+ and ecm33+ were used as long and short half‐life controls, respectively; qPCR was performed for the endogenous mRNAs. Half‐lives (95% confidence interval): mad1 + 5.6 min (4.3–8.4), mad2 + 7.7 min (6.2–10.4), mad3 + 5.2 min (4.3–6.9), act1+ 61.8 min (37.2–172.3), ecm33+ 5.0 min (4.5–5.7).
-
EProtein abundances after translation shut‐off with cycloheximide (CHX); n = 3 experiments, error bars = std. Lines indicate fit to a one‐phase exponential decay. Cdc2 and Cdc13 were used as long and short half‐life controls, respectively. Immunoblots for the endogenous proteins (no tag). A representative experiment shown in Appendix Fig S2E.
Source data are available online for this figure.
