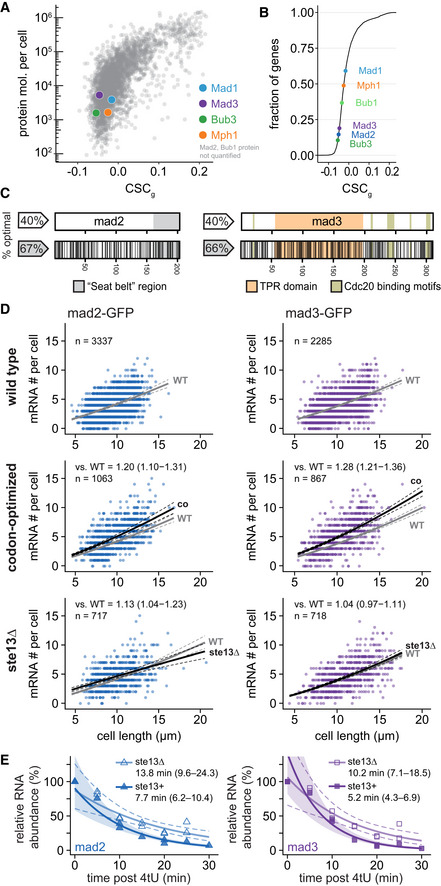
Figure 3. Codon‐optimization increases the steady‐state mRNA numbers of mad2 and mad3.

-
AThe mean CSC value for each S. pombe gene (CSCg) relative to protein number per cell by mass spectrometry (Carpy et al, 2014). CSC was determined using the mRNA half‐life data by Eser et al (2016) as described in Methods. Colored dots highlight proteins of interest. For Mad2 and Bub1, no protein abundance data was available.
-
BCumulative frequency distribution of the CSCg values for protein‐coding S. pombe genes. The position of spindle assembly checkpoint genes is highlighted.
-
CSchematic of the mad2 + and mad3 + genes. Regions coding for important structural features are highlighted. Black lines in the bottom graph indicate synonymous codon changes in the codon‐optimized version.
-
DScatter plots of whole‐cell RNA counts versus cell length. Solid lines are regression curves from generalized linear mixed model fits (gray: wild type, black: codon‐optimized or ste13Δ). Dashed lines: 95% bootstrap confidence bands for the regression curves. Model estimates of the ratio relative to wild‐type mRNA are included with bootstrap 95% confidence interval in brackets. Two to five replicates per genotype.
-
ETime course of RNA abundances by qPCR following metabolic labeling and removal of the labeled pool (two independent experiments). Solid lines: regression curves from generalized linear mixed model fits (dark = ste13 +, light = ste13Δ), excluding t = 0 to accommodate for non‐instantaneous labeling by 4tU. Shaded area: 95% bootstrap confidence band for ste13 +; dashed lines: 95% bootstrap confidence band for ste13Δ. Half‐life estimates are included with 95% bootstrap confidence intervals in brackets. See Fig EV2C for additional statistics. The ste13 + data are the same as in Fig 2.
Source data are available online for this figure.
