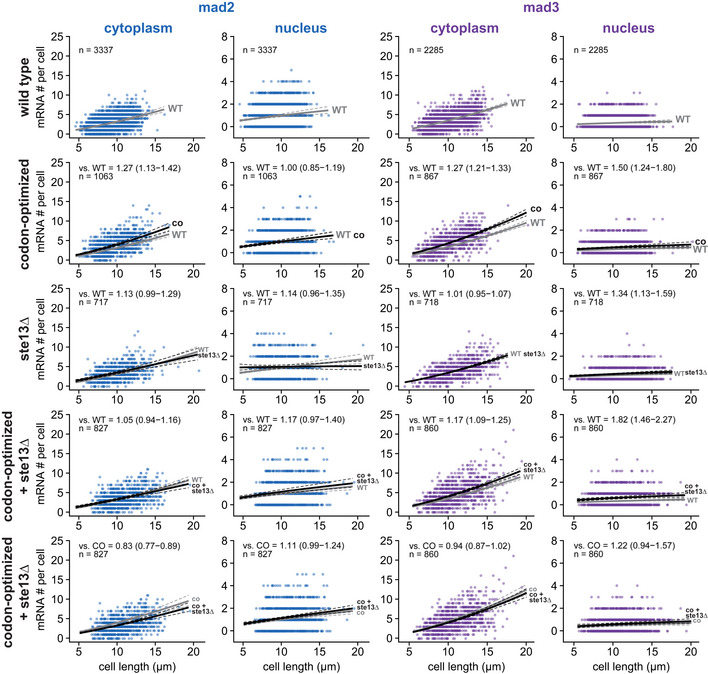
Figure EV3. Cytoplasmic and nuclear FISH data for mad2 + and mad3 + .

Scatter plots of cytoplasmic and nuclear mRNA counts versus cell length for mad2 + and mad3 +. Solid lines are regression curves from generalized linear mixed model fits; gray is wild type (WT) in rows 1–4 and codon‐optimized (co) in row 5, black is the genotype indicated. Dashed lines represent 95% bootstrap confidence bands for the regression curves. Model estimates for the mRNA ratio between the genotype indicated on the left and the respective reference are included in the plots with bootstrap 95% confidence intervals in parentheses. Same experiments as whole‐cell data in Figs 1D and 3D, and EV2B. Two to five replicates per genotype.
Source data are available online for this figure.
