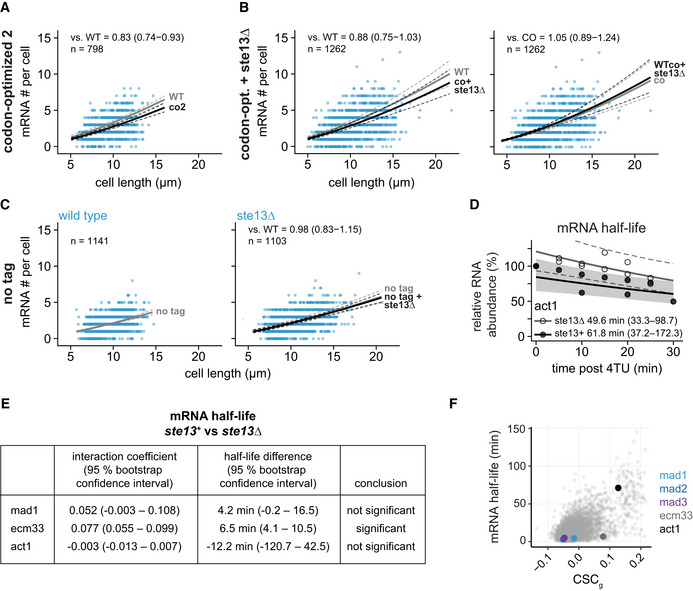
Figure EV4. Additional data on mad1 + mRNA number and half‐life after codon‐optimization or ste13 + deletion.

-
AScatter plot of whole‐cell mRNA counts versus cell length. Solid lines are regression curves from generalized linear mixed model (GLMM) fits; black for the genotype shown (co2), gray for the wild‐type (WT) reference. Dashed lines represent 95% bootstrap confidence bands for the regression curves. Model estimates for the mRNA ratio between the genotypes indicated are included in the plots with bootstrap 95% confidence intervals in parentheses. Two to three replicates per genotype.
-
BAs in (A). Black regression line for the genotype shown (co + ste13Δ), gray for the respective reference, wild type (WT) or codon‐optimized (co). Two to three replicates per genotype.
-
CScatter plots for whole‐cell mRNA counts of untagged mad1 + in ste13 + (left) or ste13Δ (right) cells, similar to (A). The regression curve for untagged mad1 + in ste13 + is shown in gray, that for untagged mad1 + in ste13Δ in black. Probes were against the mad1 + coding sequence. One to three replicates per genotype.
-
DTime course of RNA abundances by qPCR following metabolic labeling and removal of the labeled pool (two independent experiments). Solid lines are regression curves from GLMM fits (black = ste13 +, gray = ste13Δ), excluding the measurements at t = 0 to accommodate for noninstantaneous labeling by 4tU. Shaded area is 95% bootstrap confidence band for the ste13 + curve and dashed lines indicate 95% bootstrap confidence band for the ste13Δ curve. Half‐life estimates with 95% bootstrap confidence intervals are included on the plot. The ste13 + data are the same as in Fig 2.
-
EStatistical significance for mRNA half‐life changes after deletion of ste13 +. First and second columns show estimates and 95% bootstrap confidence intervals for the model interaction coefficient and the half‐life difference, respectively. The change in half‐life after deletion of ste13 + was considered significant if the 95% bootstrap confidence intervals for the interaction coefficient and the half‐life difference excluded 0.
-
FCSCg values (this study) and mRNA half‐lives (from Eser et al, 2016) for protein‐coding S. pombe genes with the indicated genes highlighted.
Source data are available online for this figure.
